OPMT 1197
Business Statistics
Lectures 23-24: Simple Linear Regression
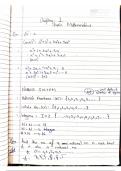
Example 1: You are working in the entertainment field. You would like to predict how much a
single man spends on entertainment per month based on his annual income. You think there is a
linear relationship between a man’s annual income and how much he spends on entertainment.
Below is the data for a random sample of 6 single men:
Name Annual Income Entertainment
(in $1,000’s) Spending ($)
Ralph 5 50
Chris 15 300
Steve 25 550
Jamie 35 750
Wilson 35 600
Michael 95 1,050
(a) Identify the independent and dependent variables.
(b) Use the method of least squares to find the estimated regression line.
(c) Calculate the mean amount spent on entertainment per month and the mean annual income for
the sample of 6 single men.
(d) Use the regression line to predict the amount a single man would spend on entertainment per
month if his annual income is $95,000. What is the error on the prediction?
(e) Predict the amount a single man would spend on entertainment per month if his annual income
is $1,000,000. Would you have any concerns about this estimate?
(f) Plot the estimated regression line.
(g) Interpret the slope using the words of the problem
(h) Interpret the intercept using the words of the problem.
(i) Find the sample correlation coefficient, r. Interpret it using the words of the problem.
(j) Calculate the coefficient of determination, r2. Interpret it using the words of the problem.
(k) Construct a 95% confidence interval estimate for the population slope.
(l) Is there enough evidence to conclude there is a linear relationship between annual income and
the amount spent on entertainment? Test the hypothesis at the 5% level of significance (95%
confidence level).
Solutions: (b) Yˆ = 200 + 10x (c) $35,000, $550 (d) $1,150 (k) 3.64 to 16.36
Pg 1 of 12
, OPMT 1197
Business Statistics
Amount Spent on Entertainment vs Annual Income
1250
Spending on Entertainment ($)
1000
750
500
250
0
0 25 50 75 100
Annual Income (in $1,000’s)
After plotting the data, you think the amount a single man spends on entertainment is affected by
his annual income. The relationship looks linear so you use Excel to do a linear regression.
Scatter Plot of Entertainment and Income
1200
1000
Entertainment ($)
800
600
400
200
0
0 25 50 75 100
Income (in $1,000's)
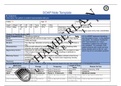
SUMMARY OUTPUT
Regression Statistics
Multiple R 0.9091
R Square 0.8264
Adjusted R Square 0.783
Standard Error 162.0
Observations 6
Coefficients Standard Error t Stat P-value Lower 95% Upper 95%
Intercept 200 103.95 1.924 0.12660 -88.62 488.62
Income 10 2.2913 4.364 0.01202 3.64 16.36
Pg 2 of 12
Business Statistics
Lectures 23-24: Simple Linear Regression
Example 1: You are working in the entertainment field. You would like to predict how much a
single man spends on entertainment per month based on his annual income. You think there is a
linear relationship between a man’s annual income and how much he spends on entertainment.
Below is the data for a random sample of 6 single men:
Name Annual Income Entertainment
(in $1,000’s) Spending ($)
Ralph 5 50
Chris 15 300
Steve 25 550
Jamie 35 750
Wilson 35 600
Michael 95 1,050
(a) Identify the independent and dependent variables.
(b) Use the method of least squares to find the estimated regression line.
(c) Calculate the mean amount spent on entertainment per month and the mean annual income for
the sample of 6 single men.
(d) Use the regression line to predict the amount a single man would spend on entertainment per
month if his annual income is $95,000. What is the error on the prediction?
(e) Predict the amount a single man would spend on entertainment per month if his annual income
is $1,000,000. Would you have any concerns about this estimate?
(f) Plot the estimated regression line.
(g) Interpret the slope using the words of the problem
(h) Interpret the intercept using the words of the problem.
(i) Find the sample correlation coefficient, r. Interpret it using the words of the problem.
(j) Calculate the coefficient of determination, r2. Interpret it using the words of the problem.
(k) Construct a 95% confidence interval estimate for the population slope.
(l) Is there enough evidence to conclude there is a linear relationship between annual income and
the amount spent on entertainment? Test the hypothesis at the 5% level of significance (95%
confidence level).
Solutions: (b) Yˆ = 200 + 10x (c) $35,000, $550 (d) $1,150 (k) 3.64 to 16.36
Pg 1 of 12
, OPMT 1197
Business Statistics
Amount Spent on Entertainment vs Annual Income
1250
Spending on Entertainment ($)
1000
750
500
250
0
0 25 50 75 100
Annual Income (in $1,000’s)
After plotting the data, you think the amount a single man spends on entertainment is affected by
his annual income. The relationship looks linear so you use Excel to do a linear regression.
Scatter Plot of Entertainment and Income
1200
1000
Entertainment ($)
800
600
400
200
0
0 25 50 75 100
Income (in $1,000's)
SUMMARY OUTPUT
Regression Statistics
Multiple R 0.9091
R Square 0.8264
Adjusted R Square 0.783
Standard Error 162.0
Observations 6
Coefficients Standard Error t Stat P-value Lower 95% Upper 95%
Intercept 200 103.95 1.924 0.12660 -88.62 488.62
Income 10 2.2913 4.364 0.01202 3.64 16.36
Pg 2 of 12