

Emory University QTM 100 LE12 Lab 8: Exploring
Inferential Statistics & Sampling Distributions | Practice
Questions & Verified Answers | 2026 Edition
1. Explore inferential results when we repeatedly sample from height m.
(a) Examine the population distribution of height m.
• Describe the shape of the population distribution.
Code
#Shows the shape of the population
distribution
hist(yrbss2013$height_m)
Output
Answer
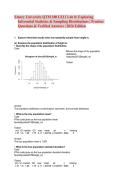
The population distribution is bell-shaped, symmetric, and normally distributed.
• What is the true population mean?
Code
#This code gives us the true population mean
favstats(yrbss2013$height_m)
Output
min Q1 median Q3 max mean sd n missing
1.27 1.6 1.68 1.75 2.11 1.68729 0.1029791 8482 0
Answer
The true population mean is 1.687.
• What is the true population standard deviation?
Code
#This code gives us the true population standard deviation
favstats(yrbss2013$height_m)
Output
min Q1 median Q3 max mean sd n missing
1.27 1.6 1.68 1.75 2.11 1.68729 0.1029791 8482 0
, Answer
The true population standard deviation is 0.103.
(b) Consider taking samples of size n = 20 from this population. Are sampling distribution
assumptions satisfied for valid inference? Why or why not?
All assumptions are satisfied. We can assume that the data represents a random sample from
the population, the observations are independent from one another, and it appears to be
symmetric and bell shaped (according to the histogram).
(c) Fill in the blanks and circle the correct word choice. Consider inference at the α = 0.05
level of significance.
We are testing H0: μ = 1.687 versus Ha: μ S 1.687 . In the hypothesis test, we run the risk of
committing a (Type I/Type II) error because in reality the null hypothesis is actually (true/false).
The targeted (Type I/Type II) error rate is 0.05 and the targeted confidence interval coverage
is 95% . Because sampling distribution assumptions (are/are not) satisfied, we expect the
observed Type I error rate and confidence interval coverage from simulation results to
(equal/not equal) the targeted levels.
(d) Write and execute code to perform inference for 100 samples of size n = 20 from the
height m variable at the α = 0.05 level of significance. Explore the hypothesis test results.
• Describe the shape of the distribution of the sample means:
Code
#Creates a new variable to perform inference for the sample
sim1<-inference.means(variable=yrbss2013$height_m, sample.size=20, alpha=0.05,
num.reps=100)
#Performs inference for the sample
sim1
#Shows the distribution of sample means
hist(sim1$samp.est,main="Sample Means”)
Output
Answer
The distribution of sample means is bell-shaped, symmetric, and normally distributed.
Inferential Statistics & Sampling Distributions | Practice
Questions & Verified Answers | 2026 Edition
1. Explore inferential results when we repeatedly sample from height m.
(a) Examine the population distribution of height m.
• Describe the shape of the population distribution.
Code
#Shows the shape of the population
distribution
hist(yrbss2013$height_m)
Output
Answer
The population distribution is bell-shaped, symmetric, and normally distributed.
• What is the true population mean?
Code
#This code gives us the true population mean
favstats(yrbss2013$height_m)
Output
min Q1 median Q3 max mean sd n missing
1.27 1.6 1.68 1.75 2.11 1.68729 0.1029791 8482 0
Answer
The true population mean is 1.687.
• What is the true population standard deviation?
Code
#This code gives us the true population standard deviation
favstats(yrbss2013$height_m)
Output
min Q1 median Q3 max mean sd n missing
1.27 1.6 1.68 1.75 2.11 1.68729 0.1029791 8482 0
, Answer
The true population standard deviation is 0.103.
(b) Consider taking samples of size n = 20 from this population. Are sampling distribution
assumptions satisfied for valid inference? Why or why not?
All assumptions are satisfied. We can assume that the data represents a random sample from
the population, the observations are independent from one another, and it appears to be
symmetric and bell shaped (according to the histogram).
(c) Fill in the blanks and circle the correct word choice. Consider inference at the α = 0.05
level of significance.
We are testing H0: μ = 1.687 versus Ha: μ S 1.687 . In the hypothesis test, we run the risk of
committing a (Type I/Type II) error because in reality the null hypothesis is actually (true/false).
The targeted (Type I/Type II) error rate is 0.05 and the targeted confidence interval coverage
is 95% . Because sampling distribution assumptions (are/are not) satisfied, we expect the
observed Type I error rate and confidence interval coverage from simulation results to
(equal/not equal) the targeted levels.
(d) Write and execute code to perform inference for 100 samples of size n = 20 from the
height m variable at the α = 0.05 level of significance. Explore the hypothesis test results.
• Describe the shape of the distribution of the sample means:
Code
#Creates a new variable to perform inference for the sample
sim1<-inference.means(variable=yrbss2013$height_m, sample.size=20, alpha=0.05,
num.reps=100)
#Performs inference for the sample
sim1
#Shows the distribution of sample means
hist(sim1$samp.est,main="Sample Means”)
Output
Answer
The distribution of sample means is bell-shaped, symmetric, and normally distributed.


