WGU C957 Applied Algebra – Questions & Appropriate
Solutions
Save
Students also studied
Chapter 29- Chest and Abdominal Tr... Chapter 21 Test Ch. 22 Study Guide
348 terms 24 terms 32 terms
anaphylacticshock Preview kenanderson2017 Preview Kendall_Dinning
Practice questions for this set
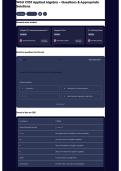
Learn 1/6 Study using Learn
used to find the best-fit line for the scatterplot
Choose an answer
1 Constant e 2 coefficient of determination
3 k 4 least-squares regression algorithm
Don't know?
Terms in this set (121)
Constant e 2.71828
slope-intercept formula y = mx + b
L+m the upper limit of a logistic function equation
m the lower limit of a logistic equation
k rate of increase for a logistic equation
C start of increase for a logistic equation
linear function that is a straight line
polynomial function with curves and no asymptote
, 0.7-1.0 r^2-value showing a strong correlation
0.3-0.7 r^2-value showing a moderate correlation
0.0-0.3 r^2-value showing a weak correlation
outlier a data point which is distinctly separate from all others within a
data set for reasons beyond the data
coefficient of determination rating how well the function fits the real world data
r^2 coefficient of determination
regression equation best fit equation for a set of real world data
Concave up y = x^2
Concave down y = -x^2
inflection point a point where the concavity changes
asymptote a line that continually approaches a given curve but does not
meet it at any finite distance. A natural limitation
exponential function a function with 1 curve and 1 asymptote
logistic function function with 2 curves and 2 asymptotes
Concave up parameters the function is increasing at an faster and faster rate OR
the function is decreasing at a slower and slower rate
concave down parameters the function is increasing at a slower and slower rate OR
the function is decreasing at a faster and faster rate
quantitative variable a characteristic that can be measured numerically
qualitative variable do not have a numerical value, but describe something;
colors, car model, political party, computer brands
independent variable explains, influences, or affects the other variable; located on
the x-axis of a graph
dependent variable responds to the IV; located on the y-axis
input independent variable
output dependent variable
function notation f(input) = output or f(x) = y
inverse function a function that "undoes" what the original function does
Solutions
Save
Students also studied
Chapter 29- Chest and Abdominal Tr... Chapter 21 Test Ch. 22 Study Guide
348 terms 24 terms 32 terms
anaphylacticshock Preview kenanderson2017 Preview Kendall_Dinning
Practice questions for this set
Learn 1/6 Study using Learn
used to find the best-fit line for the scatterplot
Choose an answer
1 Constant e 2 coefficient of determination
3 k 4 least-squares regression algorithm
Don't know?
Terms in this set (121)
Constant e 2.71828
slope-intercept formula y = mx + b
L+m the upper limit of a logistic function equation
m the lower limit of a logistic equation
k rate of increase for a logistic equation
C start of increase for a logistic equation
linear function that is a straight line
polynomial function with curves and no asymptote
, 0.7-1.0 r^2-value showing a strong correlation
0.3-0.7 r^2-value showing a moderate correlation
0.0-0.3 r^2-value showing a weak correlation
outlier a data point which is distinctly separate from all others within a
data set for reasons beyond the data
coefficient of determination rating how well the function fits the real world data
r^2 coefficient of determination
regression equation best fit equation for a set of real world data
Concave up y = x^2
Concave down y = -x^2
inflection point a point where the concavity changes
asymptote a line that continually approaches a given curve but does not
meet it at any finite distance. A natural limitation
exponential function a function with 1 curve and 1 asymptote
logistic function function with 2 curves and 2 asymptotes
Concave up parameters the function is increasing at an faster and faster rate OR
the function is decreasing at a slower and slower rate
concave down parameters the function is increasing at a slower and slower rate OR
the function is decreasing at a faster and faster rate
quantitative variable a characteristic that can be measured numerically
qualitative variable do not have a numerical value, but describe something;
colors, car model, political party, computer brands
independent variable explains, influences, or affects the other variable; located on
the x-axis of a graph
dependent variable responds to the IV; located on the y-axis
input independent variable
output dependent variable
function notation f(input) = output or f(x) = y
inverse function a function that "undoes" what the original function does