Week 1
,Hoorcollege 1
FN = False negative, je voorspelt niks maar er is wel wat
FP = False Positive, je voorspelt wat maar er is niks
TP = True Positive, je voorspelt wat en er is wat
Hoorcollege 2
Process data
- Maak data ready voor gebruik (missing data, foute data)
Innerjoin = Tabellen samenvoegen op basis van overeenkomenden variabelen
leftjoin = Alles van tabel A + overeenkomende variabelen A en B
rightjoin = Alles van tabel B + overeenkomende variabelen A en B
outer join = Alles
Scaling = transforms variables to have another distribution, which puts variables at the
same scale and makes the data work better on many models.
- Z-score scaling
- (representing how many standard deviations from the mean)
- (D-D.mean()) / D.std()
- min-max scaling
- (making the value range between 0 and 1)
- outliers verwijderen
- (D-D.min()) / (D.max()-D.min())
Quantization = transforms a continuous set of values (e.g., integers)
into a discrete set (e.g., categories). For example, age is quantized to age range
- bin = [0,20,50,200]
- L = ["1-20","21-50","51+"]
- pandas.cut(D["age"], bin, labels=L)
resample = You can resample time series data (i.e., the data with time stamps) to a different
frequency (e.g., hourly) using different aggregation methods (e.g., mean).
- D.resample("60Min", label="right").mean()
rolling window operation = You can use the rolling window operation to transform time
series data using different aggregation methods (e.g., sum).
- D["v2"]=D["v1"].rolling(window=3).sum()
,Transformation =
Regular expression
- To extract data from text or match text patterns
-
Drop data
- .. u dont need
- pandas.drop(columns=["year"])
- pandas.drop([5, 6])
replace the missing values
- With mean, median or constant
model missing values
- 𝑦 is the variable/column that has the missing values, 𝑋 means other variables, and 𝐹
is a regression function.
- 𝑦 = 𝐹(𝑋)
MCAR (Missing Completely At Random) = Missing data is a completely random subset
(no relations) of the entire dataset
MAR (Missing at Random) = Missing data is only related to variables other than the one
having missing data
MNAR (Missing Not At Random) = Missing data is related to the variable that has the
missing data. (e.g., sensitive questions
, Classification & regression
Classification = Categorieën voorspellen (labels).
Regression = Numerieke waarden voorspellen (getallen).
Classification
- f.e. kijken of iets spam of niet is
- Veel voorbeelden nodig om het model te trainen
- Extract features (information) using human knowledge
- Door features x te gebruiken om een message als data point te plotten
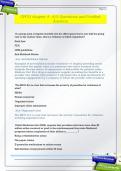
Lijn bedenken bij de punten (linear classifier)
- Eerst error metric (hoe goed of slecht is de lijn)
- Sum of distances between the misclassified points and line f
- Als een punt misclassified is = aan de verkeerde kant van de lijn
-
- Probleem is dat het na error = 0 alles goed is en het algoritme op elk moment kan
stoppen dus krijg je niet steeds hetzelfde resultaat
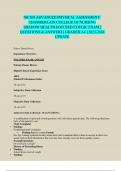
Evaluation metrics (Is het model goed of niet?, = to compare different models)
- Kan niet door te kijken naar error want die wordt bij elk model anders gemeten
-
- What if dataset is imbalanced (Sommige classes hebben veel minder data)
,Hoorcollege 1
FN = False negative, je voorspelt niks maar er is wel wat
FP = False Positive, je voorspelt wat maar er is niks
TP = True Positive, je voorspelt wat en er is wat
Hoorcollege 2
Process data
- Maak data ready voor gebruik (missing data, foute data)
Innerjoin = Tabellen samenvoegen op basis van overeenkomenden variabelen
leftjoin = Alles van tabel A + overeenkomende variabelen A en B
rightjoin = Alles van tabel B + overeenkomende variabelen A en B
outer join = Alles
Scaling = transforms variables to have another distribution, which puts variables at the
same scale and makes the data work better on many models.
- Z-score scaling
- (representing how many standard deviations from the mean)
- (D-D.mean()) / D.std()
- min-max scaling
- (making the value range between 0 and 1)
- outliers verwijderen
- (D-D.min()) / (D.max()-D.min())
Quantization = transforms a continuous set of values (e.g., integers)
into a discrete set (e.g., categories). For example, age is quantized to age range
- bin = [0,20,50,200]
- L = ["1-20","21-50","51+"]
- pandas.cut(D["age"], bin, labels=L)
resample = You can resample time series data (i.e., the data with time stamps) to a different
frequency (e.g., hourly) using different aggregation methods (e.g., mean).
- D.resample("60Min", label="right").mean()
rolling window operation = You can use the rolling window operation to transform time
series data using different aggregation methods (e.g., sum).
- D["v2"]=D["v1"].rolling(window=3).sum()
,Transformation =
Regular expression
- To extract data from text or match text patterns
-
Drop data
- .. u dont need
- pandas.drop(columns=["year"])
- pandas.drop([5, 6])
replace the missing values
- With mean, median or constant
model missing values
- 𝑦 is the variable/column that has the missing values, 𝑋 means other variables, and 𝐹
is a regression function.
- 𝑦 = 𝐹(𝑋)
MCAR (Missing Completely At Random) = Missing data is a completely random subset
(no relations) of the entire dataset
MAR (Missing at Random) = Missing data is only related to variables other than the one
having missing data
MNAR (Missing Not At Random) = Missing data is related to the variable that has the
missing data. (e.g., sensitive questions
, Classification & regression
Classification = Categorieën voorspellen (labels).
Regression = Numerieke waarden voorspellen (getallen).
Classification
- f.e. kijken of iets spam of niet is
- Veel voorbeelden nodig om het model te trainen
- Extract features (information) using human knowledge
- Door features x te gebruiken om een message als data point te plotten
Lijn bedenken bij de punten (linear classifier)
- Eerst error metric (hoe goed of slecht is de lijn)
- Sum of distances between the misclassified points and line f
- Als een punt misclassified is = aan de verkeerde kant van de lijn
-
- Probleem is dat het na error = 0 alles goed is en het algoritme op elk moment kan
stoppen dus krijg je niet steeds hetzelfde resultaat
Evaluation metrics (Is het model goed of niet?, = to compare different models)
- Kan niet door te kijken naar error want die wordt bij elk model anders gemeten
-
- What if dataset is imbalanced (Sommige classes hebben veel minder data)