CFA Level 2 CFA Level 2 Study Guide
Study online at https://quizlet.com/_hmt5b3
1. Independent X - explanatory variables
variable
2. Dependent Vari- Y - explained variable
able
3. 3 Primary As- 1) Multicolinearity (linear relationship between x & y variables should exist) 2)
sumption viola- heteroskedasicity (variance of the error term should be constant. e=0) 3) Serial
tions of multi re- Correlation (residuals are correlated and normally distributed when should not
gression be)
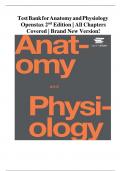
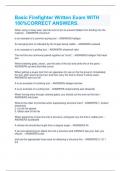
4. ANOVA table
5. R^2 using anova (SST - SSE ) / SST OR RSS / SST
table
6. Adjusted R^2 1 - ((n-1)/(n-k-1)) * (1-R^2)
7. AIC (Evaluation of regression model criteria) --> Better for forecAsting. LOWER IS
BETTER.
8. BIC (evaluation of regression model criteria) --> Better for goodness of fit. LOWER IS
BETTER.
9. F-Statsitic for re- ((SSEr - SSEu)/q) / (SSEu / (n- k -1))
stricted model.
(H0 excludes 1 or
more slope vari-
ables)
10. F statistic for un- ((SSTu - SSEu)/k) / (SSEu / (n- k -1))
restricted model
2025/2026
, CFA Level 2 CFA Level 2 Study Guide
Study online at https://quizlet.com/_hmt5b3
(H0 includes all
slope variables)
11. Regression mod- selection & transformation
el specifications
12. 4 Functional 1) Omission of important independent variables --> serial correlation or het-
Form Model Mis- eroskedasticity
specifications 2) Inappropriate variable form--> heteroskedasticity
3) Inappropriate variable scaling --> heteroskedasticity
4) Data improperly pooled --> serial correlation or heteroskedasticity
13. Unconditional Occurrs when the heteroskedasticity is not related to the level of the independent
heteroskedastici- variable; doesn't systematically go up or down with changes in the value of the
ty independent variable(s); not usually a major problem
14. Conditional het- When heteroskedasticity is related to the level of independent variables (ex.
eroskedasticity increases when variables increase)
15. Effects of con- Type I errors due to standard errors are unreliable estimates, f-test is unreliable,
ditional het-
eroskedasticity
16. Breusch-Pagan if n * r^2 > chi-square critical value, null is rejected, and we have a problem with
(BP) test conditional heteroskedasticity
17. Breush-Godfrey general test for serial correlation. F test with p and n-p-k-1 degrees of freedom
Test
18. VIF (variance in- test for multicollinearity
flation factor
test)
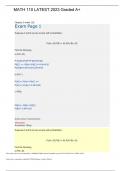
19. VIF thresholds
2025/2026
, CFA Level 2 CFA Level 2 Study Guide
Study online at https://quizlet.com/_hmt5b3
VIF = 1 -> no evidence of multicollinearity
VIF > 5 - warning, requires more investigation
VIF > 10 -- evidence of multicollinearirty
20. When p > signifi- Fail to reject null hypothesis that coefficient = 0
cant level
21. test statistic > reject the null and conclude a problem with heteroskedasticity
critical value
22. test statistic for n * r^2
BP
23. Test statistic ver- Test statistic -- think something you calculate. It is the # of standard errors you are
sus critical value away from your hypothesis.
Critical value -- think benchmark. Uses sig. level and degrees of freedom to
calculate.
24. Outliers vs. outliers = extreme observations of y variable, high-leverage points = extreme
high-leverage oberservations of x variable
points
25. Dummy vari- binary independent variables that assigned values of either 0 or 1 (can be slope
ables or intercept dummies)
26. Likelihood ratio = -2(likelihood of restricted model - likelihood of unrestricted model)
test for logistic
regression test statistic > chi-squared critical value --> reject the null hypothesis
27. Types of trend linear, and log-linear
time series
28. Log-linear equa- ln(y) = b0 + B1(t) or y = e^(b0+ b1(t))
tion
2025/2026
, CFA Level 2 CFA Level 2 Study Guide
Study online at https://quizlet.com/_hmt5b3
29. When to use a lin- when data points appear to be equally distributed above and below the regres-
ear trend model sion line
30. When to use a When residuals (off regression) tend to be persistently positive or negative (ex.
log-linear trend financial data like stock prices and company sales)
model
31. Autoregressive When the dependent variable is regressed against one or more lagged values of
model (AR) itself (ex. sales today forecasted based on sales yesterday)
x(t) = b(0) + b(1)x(t-1) + E
32. covariance sta- 1. constant mean
tionarity 2. constant variance
3. constant covariance
33. Model fit for Testing whether autocorrelations are significantly different from 0 (if the model is
the autoregres- correctly specified, no autocorrelations will be statistically significant) t-test used.
sive (AR) model
34. Root Mean (SEE) used to test the accuracy of AR models in forecasting out-of-sample values.
Squared Error LOWER than better.
35. Random walk the movement over time of an unpredictable variable -- has a unit root -- and
therefore has nonstationarity.
36. Random walk the intercept term is not equal to zero. That is, in addition to a random walk error
with a drift term, the time series is expected to increase or decrease by a constant amount
each period.
37. Dickey-Fuller Test Test for stationarity in time series data. (Unit root test)
x(t) - x(t-1) = b(0) + (b(1) -1)*(x(t-1))
2025/2026
Study online at https://quizlet.com/_hmt5b3
1. Independent X - explanatory variables
variable
2. Dependent Vari- Y - explained variable
able
3. 3 Primary As- 1) Multicolinearity (linear relationship between x & y variables should exist) 2)
sumption viola- heteroskedasicity (variance of the error term should be constant. e=0) 3) Serial
tions of multi re- Correlation (residuals are correlated and normally distributed when should not
gression be)
4. ANOVA table
5. R^2 using anova (SST - SSE ) / SST OR RSS / SST
table
6. Adjusted R^2 1 - ((n-1)/(n-k-1)) * (1-R^2)
7. AIC (Evaluation of regression model criteria) --> Better for forecAsting. LOWER IS
BETTER.
8. BIC (evaluation of regression model criteria) --> Better for goodness of fit. LOWER IS
BETTER.
9. F-Statsitic for re- ((SSEr - SSEu)/q) / (SSEu / (n- k -1))
stricted model.
(H0 excludes 1 or
more slope vari-
ables)
10. F statistic for un- ((SSTu - SSEu)/k) / (SSEu / (n- k -1))
restricted model
2025/2026
, CFA Level 2 CFA Level 2 Study Guide
Study online at https://quizlet.com/_hmt5b3
(H0 includes all
slope variables)
11. Regression mod- selection & transformation
el specifications
12. 4 Functional 1) Omission of important independent variables --> serial correlation or het-
Form Model Mis- eroskedasticity
specifications 2) Inappropriate variable form--> heteroskedasticity
3) Inappropriate variable scaling --> heteroskedasticity
4) Data improperly pooled --> serial correlation or heteroskedasticity
13. Unconditional Occurrs when the heteroskedasticity is not related to the level of the independent
heteroskedastici- variable; doesn't systematically go up or down with changes in the value of the
ty independent variable(s); not usually a major problem
14. Conditional het- When heteroskedasticity is related to the level of independent variables (ex.
eroskedasticity increases when variables increase)
15. Effects of con- Type I errors due to standard errors are unreliable estimates, f-test is unreliable,
ditional het-
eroskedasticity
16. Breusch-Pagan if n * r^2 > chi-square critical value, null is rejected, and we have a problem with
(BP) test conditional heteroskedasticity
17. Breush-Godfrey general test for serial correlation. F test with p and n-p-k-1 degrees of freedom
Test
18. VIF (variance in- test for multicollinearity
flation factor
test)
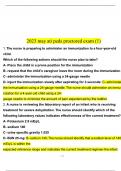
19. VIF thresholds
2025/2026
, CFA Level 2 CFA Level 2 Study Guide
Study online at https://quizlet.com/_hmt5b3
VIF = 1 -> no evidence of multicollinearity
VIF > 5 - warning, requires more investigation
VIF > 10 -- evidence of multicollinearirty
20. When p > signifi- Fail to reject null hypothesis that coefficient = 0
cant level
21. test statistic > reject the null and conclude a problem with heteroskedasticity
critical value
22. test statistic for n * r^2
BP
23. Test statistic ver- Test statistic -- think something you calculate. It is the # of standard errors you are
sus critical value away from your hypothesis.
Critical value -- think benchmark. Uses sig. level and degrees of freedom to
calculate.
24. Outliers vs. outliers = extreme observations of y variable, high-leverage points = extreme
high-leverage oberservations of x variable
points
25. Dummy vari- binary independent variables that assigned values of either 0 or 1 (can be slope
ables or intercept dummies)
26. Likelihood ratio = -2(likelihood of restricted model - likelihood of unrestricted model)
test for logistic
regression test statistic > chi-squared critical value --> reject the null hypothesis
27. Types of trend linear, and log-linear
time series
28. Log-linear equa- ln(y) = b0 + B1(t) or y = e^(b0+ b1(t))
tion
2025/2026
, CFA Level 2 CFA Level 2 Study Guide
Study online at https://quizlet.com/_hmt5b3
29. When to use a lin- when data points appear to be equally distributed above and below the regres-
ear trend model sion line
30. When to use a When residuals (off regression) tend to be persistently positive or negative (ex.
log-linear trend financial data like stock prices and company sales)
model
31. Autoregressive When the dependent variable is regressed against one or more lagged values of
model (AR) itself (ex. sales today forecasted based on sales yesterday)
x(t) = b(0) + b(1)x(t-1) + E
32. covariance sta- 1. constant mean
tionarity 2. constant variance
3. constant covariance
33. Model fit for Testing whether autocorrelations are significantly different from 0 (if the model is
the autoregres- correctly specified, no autocorrelations will be statistically significant) t-test used.
sive (AR) model
34. Root Mean (SEE) used to test the accuracy of AR models in forecasting out-of-sample values.
Squared Error LOWER than better.
35. Random walk the movement over time of an unpredictable variable -- has a unit root -- and
therefore has nonstationarity.
36. Random walk the intercept term is not equal to zero. That is, in addition to a random walk error
with a drift term, the time series is expected to increase or decrease by a constant amount
each period.
37. Dickey-Fuller Test Test for stationarity in time series data. (Unit root test)
x(t) - x(t-1) = b(0) + (b(1) -1)*(x(t-1))
2025/2026