STATISTICS 101 PRINCIPLES OF STATISTICS
STUDY.COM.ADVANCED EXAM QUESTIONS WITH
REVIEWED ACCUATE SOLUTIONS
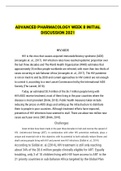
Normally distributed data Mean = 0 (if z-score = 0, then data point = mean) Standard deviation = 1 -
answer ✔✔-Graph of Z-Scores
Normally distributed data Mean = 0 (if z-score = 0, then data point = mean) Standard deviation = 1 -
answer ✔✔-Graph of Z-Scores
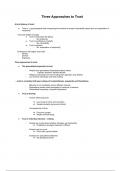
For normally distributed data:
--68% of data within 1 standard deviation
of the mean.
--95% of data within 2 standard deviations
of the mean.
--99.7% of data within 3 standard deviations
of the mean. - answer ✔✔-Empirical Rule
(68-95-99.7 Rule)
You use this process model when
dealing with a number of possible
outcomes that you cannot count. If you
can count outcomes, you should use
discrete probability distribution - answer ✔✔-Continuous Probability Distribution
Z-score for 20 years: (22 - 18) / 2 = 2
2.0 on table: 0.97725
Subtract from 1 to find percent greater
,(to the right): 1 - 0.97725 = 0.02275 =
2.275% - answer ✔✔-The average life span of tabby cats is 18 years with a standard deviation of 2.
Determine the percentage of tabby cats that will live longer than 22 years
Z-score for 11 inches: (11 - 12.5) / 0.5 = -3
-3.0 on table: 0.00135
0.00135 x 1000 = 1.35 = 1 cat - answer ✔✔-The average tail length of tabby cats is 12.5 inches with a
standard deviation of 0.5. Determine the number of tabby cats that will have a tailless than than 11
inches in a population of 1,000
1. Locate z-scores on 'Z-Scores and Normal Curve Areas' table
2. Subtract values by 0.500 if table measures from 0 (if area for 1 = 0.8413)
3. Subtract larger z-score area by smaller z-score area - answer ✔✔-Characteristics & Example
Determining the Area Between Two Z-Scores
n = number of trials, p = probability of success
Mean = np
Standard deviation = √(np(1-p))
To solve: calculate z-score(s), find value(s) on normal distribution table, calculate probability - answer
✔✔-How to use the normal distribution to approximate binomial distribution
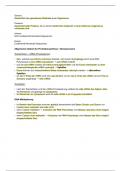
Graph using the normal distribution to approximate the binomial distribution - answer ✔✔-Graph of
Normal Distribution
Calculate the probability of getting at least 12 heads when flipping a fair coin 40 times,
Mean = np = 40 x 0.5 = 20
, Standard deviation = √(40 x 0.5 x (1 -0.5)) = 3.2
Z-score of 12: (12 - 20) / 3.2 = -2.5 -2.5 on table: 0.0062
1 - 0.0062 = 0.9938 = 99% - answer ✔✔-Calculate the probability of getting at least 12 heads when
flipping a fair coin 40 times
This describes the number of standard deviations a data point is from the mean. It's useful for quickly
and accurately determining normal distribution probabilities - answer ✔✔-Z-Score
1. Subtract the data point by the mean.
2. Divide the difference by the standard deviation.
If result is negative it is to the left of the mean on the graph of normal distribution - answer ✔✔-
Calculating the Z-Score
1. z = 1: 0.84134 z = -1: 0.15866
2. 0.84134 - 0.500 = 0.34134 0.15866 -
0.500 = -0.34134
3. 0.34134 - -0.34134 = 0.68268
The average whisker length of tabby
cats is 4.4 inches with a standard
deviation of 0.2. Determine the
percentage of cats with a whisker
length between 4.2 and 4.8 inches,
Z-score for 4.2 inches: (4.2 - 4.4) / 0.2 = -1
Z-score for 4.8 inches: (4.8 - 4.4) / 0.2 = 2
-1.0 on table: 0.15866
2.0 on table: 0.97725
0.97725 - 0.15866 = 0.81859 = 81.9% =
82% - answer ✔✔-Find the area that falls between z = 1 and z = -1
STUDY.COM.ADVANCED EXAM QUESTIONS WITH
REVIEWED ACCUATE SOLUTIONS
Normally distributed data Mean = 0 (if z-score = 0, then data point = mean) Standard deviation = 1 -
answer ✔✔-Graph of Z-Scores
Normally distributed data Mean = 0 (if z-score = 0, then data point = mean) Standard deviation = 1 -
answer ✔✔-Graph of Z-Scores
For normally distributed data:
--68% of data within 1 standard deviation
of the mean.
--95% of data within 2 standard deviations
of the mean.
--99.7% of data within 3 standard deviations
of the mean. - answer ✔✔-Empirical Rule
(68-95-99.7 Rule)
You use this process model when
dealing with a number of possible
outcomes that you cannot count. If you
can count outcomes, you should use
discrete probability distribution - answer ✔✔-Continuous Probability Distribution
Z-score for 20 years: (22 - 18) / 2 = 2
2.0 on table: 0.97725
Subtract from 1 to find percent greater
,(to the right): 1 - 0.97725 = 0.02275 =
2.275% - answer ✔✔-The average life span of tabby cats is 18 years with a standard deviation of 2.
Determine the percentage of tabby cats that will live longer than 22 years
Z-score for 11 inches: (11 - 12.5) / 0.5 = -3
-3.0 on table: 0.00135
0.00135 x 1000 = 1.35 = 1 cat - answer ✔✔-The average tail length of tabby cats is 12.5 inches with a
standard deviation of 0.5. Determine the number of tabby cats that will have a tailless than than 11
inches in a population of 1,000
1. Locate z-scores on 'Z-Scores and Normal Curve Areas' table
2. Subtract values by 0.500 if table measures from 0 (if area for 1 = 0.8413)
3. Subtract larger z-score area by smaller z-score area - answer ✔✔-Characteristics & Example
Determining the Area Between Two Z-Scores
n = number of trials, p = probability of success
Mean = np
Standard deviation = √(np(1-p))
To solve: calculate z-score(s), find value(s) on normal distribution table, calculate probability - answer
✔✔-How to use the normal distribution to approximate binomial distribution
Graph using the normal distribution to approximate the binomial distribution - answer ✔✔-Graph of
Normal Distribution
Calculate the probability of getting at least 12 heads when flipping a fair coin 40 times,
Mean = np = 40 x 0.5 = 20
, Standard deviation = √(40 x 0.5 x (1 -0.5)) = 3.2
Z-score of 12: (12 - 20) / 3.2 = -2.5 -2.5 on table: 0.0062
1 - 0.0062 = 0.9938 = 99% - answer ✔✔-Calculate the probability of getting at least 12 heads when
flipping a fair coin 40 times
This describes the number of standard deviations a data point is from the mean. It's useful for quickly
and accurately determining normal distribution probabilities - answer ✔✔-Z-Score
1. Subtract the data point by the mean.
2. Divide the difference by the standard deviation.
If result is negative it is to the left of the mean on the graph of normal distribution - answer ✔✔-
Calculating the Z-Score
1. z = 1: 0.84134 z = -1: 0.15866
2. 0.84134 - 0.500 = 0.34134 0.15866 -
0.500 = -0.34134
3. 0.34134 - -0.34134 = 0.68268
The average whisker length of tabby
cats is 4.4 inches with a standard
deviation of 0.2. Determine the
percentage of cats with a whisker
length between 4.2 and 4.8 inches,
Z-score for 4.2 inches: (4.2 - 4.4) / 0.2 = -1
Z-score for 4.8 inches: (4.8 - 4.4) / 0.2 = 2
-1.0 on table: 0.15866
2.0 on table: 0.97725
0.97725 - 0.15866 = 0.81859 = 81.9% =
82% - answer ✔✔-Find the area that falls between z = 1 and z = -1