1
Assignment PHM2612
Module 10. Cohort Studies
Complete this quiz on Canvas by or before the due date on the course calendar. Please note that
you will only have one attempt to complete the quiz; however, there is no time limit. You may
use this document to answer the questions prior to submitting your answers on Canvas. For
questions requiring calculations, keep 5 decimal places for intermediate steps and round
your final answers to two decimal places. (100 points)
1. Cohort studies compare incidence rates of exposure between disease groups and groups
without the disease. (2 points)
A. True
B. False
2. In a study where the goal is to evaluate whether a given occupational group has a higher
risk of a given outcome, it would be appropriate to select construction workers as the
exposure group and people from the general population as the non-exposure group is
appropriate. (2 points)
A. True
B. False
3. Relative risk in a cohort study is the ratio of the risk of exposure among diseased
individuals to the risk of exposure among those without the disease (2 points)
A. True
B. False
4. What are advantages of the cohort study design? Select all that apply (2 points)
It can provide a direct estimate of risk.
It is open to several types of selection bias.
It is useful for assessing the temporal relationship between exposure and outcome.
It is generally less expensive and less time consuming than other study designs.
5. Participants in a cohort study can be selected based on their _________ status. (2 points)
A. Disease
B. Outcome
C. Morbidity status
D. None of the above
6. Which of the following does not describe “attrition bias”? (Check all that apply) (2 points)
, 2
A type of selection bias in which study participants become missing at some point during
the follow-up period of a study in ways that are related to the exposure and outcome
under study
A type of information bias in which a person’s responses are affected by his/her
socioeconomic status.
A type of information bias in which study participants become missing at some point
during the follow-up period of a study.
An advantage associated with the cohort study design.
7. What is one important advantage of the cohort study design? (2 points)
A. It can only provide an indirect estimate of risk.
B. Not useful for rare outcomes
C. It is useful for assessing the temporal relationship between exposure and outcome.
D. It is generally less expensive and less time-consuming than other study designs.
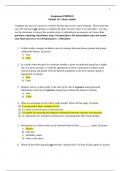
Use the following information to answer questions 8-14. Research suggests that there is a dose
response relationship between sugar intake and sleep disorders. Suppose that the table shown
below was developed using data from a 10-year cohort study. Participants were categorized
based on their sugar intake levels and followed over time to see if they developed a sleep
disorder. The referent group was those who did not consume sugar.
Person-Years of
Exposure Status New Cases of sleep disorders
Observation
No sugar intake 208 14000
Occasional sugar intake 305 17000
Frequent sugar intake 550 23000
8. Calculate the incidence density (rate) of sleep disorders per 1,000 person-years of
observation in the referent group (i.e., the unexposed). (2 points)
A. 19.69
B. 23.91
C. 17.94
D. 14.86
9. Calculate the incidence density rate ratio (also called the incidence rate ratio – IRR) for
the frequent sugar intake group compared to the referent group (i.e., the unexposed).
Don’t forget to keep 5 digits for intermediate steps. (2 points)
Assignment PHM2612
Module 10. Cohort Studies
Complete this quiz on Canvas by or before the due date on the course calendar. Please note that
you will only have one attempt to complete the quiz; however, there is no time limit. You may
use this document to answer the questions prior to submitting your answers on Canvas. For
questions requiring calculations, keep 5 decimal places for intermediate steps and round
your final answers to two decimal places. (100 points)
1. Cohort studies compare incidence rates of exposure between disease groups and groups
without the disease. (2 points)
A. True
B. False
2. In a study where the goal is to evaluate whether a given occupational group has a higher
risk of a given outcome, it would be appropriate to select construction workers as the
exposure group and people from the general population as the non-exposure group is
appropriate. (2 points)
A. True
B. False
3. Relative risk in a cohort study is the ratio of the risk of exposure among diseased
individuals to the risk of exposure among those without the disease (2 points)
A. True
B. False
4. What are advantages of the cohort study design? Select all that apply (2 points)
It can provide a direct estimate of risk.
It is open to several types of selection bias.
It is useful for assessing the temporal relationship between exposure and outcome.
It is generally less expensive and less time consuming than other study designs.
5. Participants in a cohort study can be selected based on their _________ status. (2 points)
A. Disease
B. Outcome
C. Morbidity status
D. None of the above
6. Which of the following does not describe “attrition bias”? (Check all that apply) (2 points)
, 2
A type of selection bias in which study participants become missing at some point during
the follow-up period of a study in ways that are related to the exposure and outcome
under study
A type of information bias in which a person’s responses are affected by his/her
socioeconomic status.
A type of information bias in which study participants become missing at some point
during the follow-up period of a study.
An advantage associated with the cohort study design.
7. What is one important advantage of the cohort study design? (2 points)
A. It can only provide an indirect estimate of risk.
B. Not useful for rare outcomes
C. It is useful for assessing the temporal relationship between exposure and outcome.
D. It is generally less expensive and less time-consuming than other study designs.
Use the following information to answer questions 8-14. Research suggests that there is a dose
response relationship between sugar intake and sleep disorders. Suppose that the table shown
below was developed using data from a 10-year cohort study. Participants were categorized
based on their sugar intake levels and followed over time to see if they developed a sleep
disorder. The referent group was those who did not consume sugar.
Person-Years of
Exposure Status New Cases of sleep disorders
Observation
No sugar intake 208 14000
Occasional sugar intake 305 17000
Frequent sugar intake 550 23000
8. Calculate the incidence density (rate) of sleep disorders per 1,000 person-years of
observation in the referent group (i.e., the unexposed). (2 points)
A. 19.69
B. 23.91
C. 17.94
D. 14.86
9. Calculate the incidence density rate ratio (also called the incidence rate ratio – IRR) for
the frequent sugar intake group compared to the referent group (i.e., the unexposed).
Don’t forget to keep 5 digits for intermediate steps. (2 points)