Analytical Epidemiology II: Lecture notes for the second exam
Module 8 Count modelling: understanding count data
Module learning objectives:
After successful completion of this module, students are expected to be able to:
1. Identify and distinguish count variables from other types of variables (binary, ordinal,
nominal, continuous).
2. Identify and distinguish between count variables with peculiar distributions.
3. Explain differences between distributions with continuous outcomes and count outcomes.
4. Describe the following terms: binary variable, ordinal variable, nominal variable, count
variable, continuous variable, categorical variable, numerical variable, discrete data,
censoring, truncation, probability density function, probability mass function.
Critique of categorisation:
● Issue with categorisation: It can lead to a loss of information and reduced statistical
precision.
● Example: Counts or continuous variables are sometimes dichotomised (e.g., converting
counts to binary for logistic regression).
● Recommendation: Avoid categorising variables unnecessarily, as it limits the accuracy of
statistical analysis.
Continuous data
• Continuous numbers are real numbers, ∈ ℝ.
• Continuous data have an infinite number of possibilities.
1
, • Between any two numbers is always another number.
• How to analyse continuous outcome variables?
o t-tests
o Linear regression
o Analysis of variance, ANOVA
Discrete data
• Finite set or an infinite sequence of numbers.
• The set is countable.
• Between any two numbers there is not always a third number.
Discrete data: binary outcome data
• Outcome only has two possible classes
o Y/N disease (cancer, diabetes, etc.)
• Binary outcome models, e.g.,:
o (Binary) logit regression model (yields odds ratios)
o (Binary) probit regression model (yields odds ratios)
o Binomial regression model (yields risk ratios)
The method used depends on the nature of the variable.
● Health sciences: Typically analysed using logistic regression (also called logit regression).
● Social sciences: More common to use probit analysis, though it usually gives similar results
to logistic regression.
● Epidemiology: Increasing use of binomial regression, which allows results to be expressed as
risk ratios instead of odds ratios.
Discrete data: ordered outcome data
Outcome has finite number of ordered classes:
• Mild, moderate or severe case
• Adherence to treatment (poor, reasonable, good, excellent)
• Likert scale
Ordinal outcomes are usually analysed by ordinal logit or ordinal probit regression.
Discrete data: non-ordered (nominal) outcome data
• Outcome has finite number of non-ordered classes.
• Health outcome: died, hospitalised, sick, healthy.
• Birth type (vaginal delivery, Caesarian section, miscarriage).
By contrast, nominal variables are typically analysed by polytomous logit or polytomous
2
,probit analysis. Keep in mind that regression analysis makes no assumptions about the distributions
of the independent variables. That should not be a concern in the selection of the appropriate type
of model.
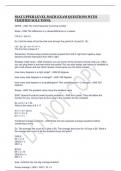
This illustrates how count data might appear in a dataset.
Dataset structure:
1. First column: Participant ID – Identifies individual study participants.
2. Second column: Sex – A binary variable (e.g., male or female).
3. Third Column: Number of traffic offenses, a count variable (values range from 0 to infinity)
generated by a counting process. Count Data refers to the collection of these individual
count values.
4. Last two columns: Exposure variables: Used in count modelling to account for differences in
exposure time between individuals. These variables allow results to be expressed as rates
(e.g., traffic offenses per person-months at risk or per kilometres travelled).
3
, 1. Number of lightning strikes experienced by individual persons
o Count data (non-negative integers).
o Exposure variable: Person (value of 1 for each person, so it is effectively ignored).
o Special distribution: None in particular.
2. Number of mosquito larvae caught in a scoop of water
o Count data.
o Exposure variable: Scoop size or number of scoops, if these vary.
o Special distribution: May have a disproportionate number of zeros if samples are
taken from areas without mosquito breeding.
3. Number of beverages consumed per day
o Count data.
o Exposure variable:
o Not needed for a 24-hour recall (fixed period).
o Required if the number of days varies across participants.
o Special distribution: None in particular.
4. Number of ‘n’-s that appear on a printed page
o Count data.
o No exposure variable needed (fixed observation unit – a page).
o Special distribution: None in particular.
5. Number of ‘n’-s minus the number of ‘p’-s that appear on a printed page
o Not count data – Subtraction can produce negative values, which are not valid for
counts.
o No exposure variable applies.
6. Number of items bought by customers in a cash transaction report
o Count data.
o No exposure variable (each transaction is a fixed unit of observation).
o Special distribution: Zero-truncated – No zeros because only paying customers are
recorded.
7. Number of items bought by people walking around in a shopping mall
o Count data.
o No exposure variable (each person is a unit of observation).
o Special distribution: Excess zeros – Many people may not buy anything.
4
Module 8 Count modelling: understanding count data
Module learning objectives:
After successful completion of this module, students are expected to be able to:
1. Identify and distinguish count variables from other types of variables (binary, ordinal,
nominal, continuous).
2. Identify and distinguish between count variables with peculiar distributions.
3. Explain differences between distributions with continuous outcomes and count outcomes.
4. Describe the following terms: binary variable, ordinal variable, nominal variable, count
variable, continuous variable, categorical variable, numerical variable, discrete data,
censoring, truncation, probability density function, probability mass function.
Critique of categorisation:
● Issue with categorisation: It can lead to a loss of information and reduced statistical
precision.
● Example: Counts or continuous variables are sometimes dichotomised (e.g., converting
counts to binary for logistic regression).
● Recommendation: Avoid categorising variables unnecessarily, as it limits the accuracy of
statistical analysis.
Continuous data
• Continuous numbers are real numbers, ∈ ℝ.
• Continuous data have an infinite number of possibilities.
1
, • Between any two numbers is always another number.
• How to analyse continuous outcome variables?
o t-tests
o Linear regression
o Analysis of variance, ANOVA
Discrete data
• Finite set or an infinite sequence of numbers.
• The set is countable.
• Between any two numbers there is not always a third number.
Discrete data: binary outcome data
• Outcome only has two possible classes
o Y/N disease (cancer, diabetes, etc.)
• Binary outcome models, e.g.,:
o (Binary) logit regression model (yields odds ratios)
o (Binary) probit regression model (yields odds ratios)
o Binomial regression model (yields risk ratios)
The method used depends on the nature of the variable.
● Health sciences: Typically analysed using logistic regression (also called logit regression).
● Social sciences: More common to use probit analysis, though it usually gives similar results
to logistic regression.
● Epidemiology: Increasing use of binomial regression, which allows results to be expressed as
risk ratios instead of odds ratios.
Discrete data: ordered outcome data
Outcome has finite number of ordered classes:
• Mild, moderate or severe case
• Adherence to treatment (poor, reasonable, good, excellent)
• Likert scale
Ordinal outcomes are usually analysed by ordinal logit or ordinal probit regression.
Discrete data: non-ordered (nominal) outcome data
• Outcome has finite number of non-ordered classes.
• Health outcome: died, hospitalised, sick, healthy.
• Birth type (vaginal delivery, Caesarian section, miscarriage).
By contrast, nominal variables are typically analysed by polytomous logit or polytomous
2
,probit analysis. Keep in mind that regression analysis makes no assumptions about the distributions
of the independent variables. That should not be a concern in the selection of the appropriate type
of model.
This illustrates how count data might appear in a dataset.
Dataset structure:
1. First column: Participant ID – Identifies individual study participants.
2. Second column: Sex – A binary variable (e.g., male or female).
3. Third Column: Number of traffic offenses, a count variable (values range from 0 to infinity)
generated by a counting process. Count Data refers to the collection of these individual
count values.
4. Last two columns: Exposure variables: Used in count modelling to account for differences in
exposure time between individuals. These variables allow results to be expressed as rates
(e.g., traffic offenses per person-months at risk or per kilometres travelled).
3
, 1. Number of lightning strikes experienced by individual persons
o Count data (non-negative integers).
o Exposure variable: Person (value of 1 for each person, so it is effectively ignored).
o Special distribution: None in particular.
2. Number of mosquito larvae caught in a scoop of water
o Count data.
o Exposure variable: Scoop size or number of scoops, if these vary.
o Special distribution: May have a disproportionate number of zeros if samples are
taken from areas without mosquito breeding.
3. Number of beverages consumed per day
o Count data.
o Exposure variable:
o Not needed for a 24-hour recall (fixed period).
o Required if the number of days varies across participants.
o Special distribution: None in particular.
4. Number of ‘n’-s that appear on a printed page
o Count data.
o No exposure variable needed (fixed observation unit – a page).
o Special distribution: None in particular.
5. Number of ‘n’-s minus the number of ‘p’-s that appear on a printed page
o Not count data – Subtraction can produce negative values, which are not valid for
counts.
o No exposure variable applies.
6. Number of items bought by customers in a cash transaction report
o Count data.
o No exposure variable (each transaction is a fixed unit of observation).
o Special distribution: Zero-truncated – No zeros because only paying customers are
recorded.
7. Number of items bought by people walking around in a shopping mall
o Count data.
o No exposure variable (each person is a unit of observation).
o Special distribution: Excess zeros – Many people may not buy anything.
4