MACROECONOMICS 318
Chapters 4 and 5 of the 2nd year macros textbook are important
(note, he will almost never ask a theory question in the exam)
CHAPTER 4
REVISION
What is economic growth?
- An increase in the standard of living (looking at GDP per capita)
- Note, economic growth is always over time
- When economists say “growth: they typically mean average rate of growth in real GDP per
capita.
• How can we have this sustained growth over a long period of time
- Growth theory considers the remarkable growth events of the last two centuriess and tries to
explain the process of economic development
History of growth theory
- Smith, Malthus, Marx, and Mill had very pessimistic views on growth
- Mill said the population would grow so rapidly that we would sink into a depression
History of economic growth
- If we look back at data before the industrial revolution, growth was very flat which is why people
were pessimistic
- The great divergence period is all thanks to changes in technology
- How would countries that did not experience the massive spike have a relation to the countries
that had the massive growth?
Representative consumer
- The consumer’s preferences over consumption and leisure as represented by indifference
curves
- The consumer’s budget constraint
- The consumer’s optimisation problem: making themselves as well off as possible given their
budget constrain
- How does the consumer respond to (i) an increase in non-wage income, and (ii) an increase in
the market real wage rate
Indifference curves
- An indifference curve slopes downward (more is preferred to less)
- An indifference curve is convex (the consumer has a preference for diversity)
- Higher indifference curves are preferred
- Indifference curves never cross
- Slope is negative of MRS
- MRS is the rate at which the consumer is willing to substitute leisure for consumption goods
1 of 102
,Representative consumer’s budget constraint
- Consumer behaves competitively (are price takers)
- Time constraint is given by l + Ns = h
- Consumption is equal to total wage income (wNs) plus dividend income (∏), minus taxes (T).
- Accounting for the time constraint we end up with: C = -wl + wh + ∏ - T
• Slope of BC is -w and intercept is wh + ∏ - T
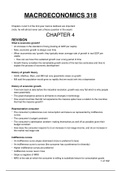
Representative consumer’s budget curve
when T< ∏
Consumer optimisation
- Assume the consumer is rational
The representative consumer chooses not
to work
Changing real dividends or taxes for the consumer
- Assume that consumption and leisure are both normal goods
- An increase in dividends or a decrease in taxes will then cause the consumer to increase
consumption and reduce the quantity of labour supplied (increase leisure)
2 of 102
,An increase in ∏ - T for the consumer
An increase in the Market Real Wage Rate
- This has income and substitution effects
- Substitution effect: the price of leisure rises, so the consumer substitutes from leisure to
consumption
- Income effect: the consumer is effectively more wealthy and, since both goods are normal,
consumption increases and leisure increases
- Conclusion: consumption must rise, but leisure may rise or fall
Increase in the Real Wage Rate-Income and Labour supply curve
Substitution effects
3 of 102
, Effect of an increase in Dividend Income or a
Decrease in Taxes
The representative firm
- The production function
- Profit maximisation and labour demand
The Firm’s Production Function
Y = zF (K , Nd)
Standard properties of this function are:
- Constant returns to scale
- Output increases with increases in either labour input or capital input
- The marginal product of labour decreases as the labour input increases
- The marginal product of capital decreases as the capital input increases
- The marginal product of labour increases as the quantity of the capital input increases
Production function, fixing the Production function, fixing the
quantity of capital, and quantity of capital, and
varying the quantity of labour varying the quantity of labour
4 of 102
Chapters 4 and 5 of the 2nd year macros textbook are important
(note, he will almost never ask a theory question in the exam)
CHAPTER 4
REVISION
What is economic growth?
- An increase in the standard of living (looking at GDP per capita)
- Note, economic growth is always over time
- When economists say “growth: they typically mean average rate of growth in real GDP per
capita.
• How can we have this sustained growth over a long period of time
- Growth theory considers the remarkable growth events of the last two centuriess and tries to
explain the process of economic development
History of growth theory
- Smith, Malthus, Marx, and Mill had very pessimistic views on growth
- Mill said the population would grow so rapidly that we would sink into a depression
History of economic growth
- If we look back at data before the industrial revolution, growth was very flat which is why people
were pessimistic
- The great divergence period is all thanks to changes in technology
- How would countries that did not experience the massive spike have a relation to the countries
that had the massive growth?
Representative consumer
- The consumer’s preferences over consumption and leisure as represented by indifference
curves
- The consumer’s budget constraint
- The consumer’s optimisation problem: making themselves as well off as possible given their
budget constrain
- How does the consumer respond to (i) an increase in non-wage income, and (ii) an increase in
the market real wage rate
Indifference curves
- An indifference curve slopes downward (more is preferred to less)
- An indifference curve is convex (the consumer has a preference for diversity)
- Higher indifference curves are preferred
- Indifference curves never cross
- Slope is negative of MRS
- MRS is the rate at which the consumer is willing to substitute leisure for consumption goods
1 of 102
,Representative consumer’s budget constraint
- Consumer behaves competitively (are price takers)
- Time constraint is given by l + Ns = h
- Consumption is equal to total wage income (wNs) plus dividend income (∏), minus taxes (T).
- Accounting for the time constraint we end up with: C = -wl + wh + ∏ - T
• Slope of BC is -w and intercept is wh + ∏ - T
Representative consumer’s budget curve
when T< ∏
Consumer optimisation
- Assume the consumer is rational
The representative consumer chooses not
to work
Changing real dividends or taxes for the consumer
- Assume that consumption and leisure are both normal goods
- An increase in dividends or a decrease in taxes will then cause the consumer to increase
consumption and reduce the quantity of labour supplied (increase leisure)
2 of 102
,An increase in ∏ - T for the consumer
An increase in the Market Real Wage Rate
- This has income and substitution effects
- Substitution effect: the price of leisure rises, so the consumer substitutes from leisure to
consumption
- Income effect: the consumer is effectively more wealthy and, since both goods are normal,
consumption increases and leisure increases
- Conclusion: consumption must rise, but leisure may rise or fall
Increase in the Real Wage Rate-Income and Labour supply curve
Substitution effects
3 of 102
, Effect of an increase in Dividend Income or a
Decrease in Taxes
The representative firm
- The production function
- Profit maximisation and labour demand
The Firm’s Production Function
Y = zF (K , Nd)
Standard properties of this function are:
- Constant returns to scale
- Output increases with increases in either labour input or capital input
- The marginal product of labour decreases as the labour input increases
- The marginal product of capital decreases as the capital input increases
- The marginal product of labour increases as the quantity of the capital input increases
Production function, fixing the Production function, fixing the
quantity of capital, and quantity of capital, and
varying the quantity of labour varying the quantity of labour
4 of 102