WGU C215 OA STUDY GUIDE WITH COMPLETE SOLUTION
BEST FOR REVISION!!
1.Average amount of time product take to move through the system:
Though- put time
2.demand-based options: A group of options that respond to demand
fluctuations through the use of inventory or back orders, or by shifting
the demand pattern.
3.finished goods inventory: -manufactured items that are completed
and ready for sale
-used to absorb demand fluctuations
4.shifting demand: a marketing strategy that attempts to shift demand
from peak periods to nonpeak periods to smooth out the demand
pattern
5.level aggregate plan: A planning approach that produces the same
quantity each time period. Inventory and back orders are used to
absorb demand fluctuations.
6.chase aggregate plan: a planning approach that varies production
to meet demand each period
7.hybrid aggregate plan: a planning approach that uses a combination of
level and chase approaches while developing the aggregate plan
8.Sales and Operations Planning: The process that companies use to
keep de- mand and supply in balance and to coordinate distribution,
marketing, and financial plans.
9.aggregate plan: Includes the budgeted levels of finished products,
inventory, backlogs, workforce size, and aggregate production rate
needed to support the marketing plan.
10.synonym for aggregate plan: production plan
11.Master Production Schedule (MPS): A part of the material
requirements plan that details how many end items will be produced
within specified periods of time
-anticipated production schedule
12.Point of Departure (POD): the percentage of normal capacity your
company is currently operating at
13.psychological criteria: a subjective definition that focuses on the
judgmental evaluation of what constitutes product or service quality
14.quality circle: a team of employees who meet on company time to
solve prob- lems of product quality
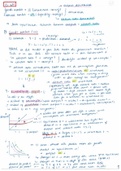
15.Fishbone diagram: cause and effect diagram
1/
11
, 16.Flowchart: A diagram that shows step-by-step progression through a
procedure or system especially using connecting lines and a set of
conventional symbols.
17.Checklists: List of common defects and the number of observed
occurrences of these defects.
18.Control chart: used to evaluate whether a process is operating within
expecta- tions relative to some measured value such as weight, width,
or volume
2/
11
BEST FOR REVISION!!
1.Average amount of time product take to move through the system:
Though- put time
2.demand-based options: A group of options that respond to demand
fluctuations through the use of inventory or back orders, or by shifting
the demand pattern.
3.finished goods inventory: -manufactured items that are completed
and ready for sale
-used to absorb demand fluctuations
4.shifting demand: a marketing strategy that attempts to shift demand
from peak periods to nonpeak periods to smooth out the demand
pattern
5.level aggregate plan: A planning approach that produces the same
quantity each time period. Inventory and back orders are used to
absorb demand fluctuations.
6.chase aggregate plan: a planning approach that varies production
to meet demand each period
7.hybrid aggregate plan: a planning approach that uses a combination of
level and chase approaches while developing the aggregate plan
8.Sales and Operations Planning: The process that companies use to
keep de- mand and supply in balance and to coordinate distribution,
marketing, and financial plans.
9.aggregate plan: Includes the budgeted levels of finished products,
inventory, backlogs, workforce size, and aggregate production rate
needed to support the marketing plan.
10.synonym for aggregate plan: production plan
11.Master Production Schedule (MPS): A part of the material
requirements plan that details how many end items will be produced
within specified periods of time
-anticipated production schedule
12.Point of Departure (POD): the percentage of normal capacity your
company is currently operating at
13.psychological criteria: a subjective definition that focuses on the
judgmental evaluation of what constitutes product or service quality
14.quality circle: a team of employees who meet on company time to
solve prob- lems of product quality
15.Fishbone diagram: cause and effect diagram
1/
11
, 16.Flowchart: A diagram that shows step-by-step progression through a
procedure or system especially using connecting lines and a set of
conventional symbols.
17.Checklists: List of common defects and the number of observed
occurrences of these defects.
18.Control chart: used to evaluate whether a process is operating within
expecta- tions relative to some measured value such as weight, width,
or volume
2/
11