Effect Yoga/Fitness op Burnout
knitr::opts_chunk$set(width.cutoff = 50)
knitr::opts_chunk$set(echo = FALSE)
Load in required libraries
## Welcome to emmeans.
## Caution: You lose important information if you filter this package's results.
## See '? untidy'
##
## Attaching package: 'jmvcore'
## The following objects are masked from 'package:base':
##
## endsWith, format, startsWith
## -- Attaching core tidyverse packages ------------------------ tidyverse 2.0.0 --
## v dplyr 1.1.4 v readr 2.1.5
## v forcats 1.0.0 v stringr 1.5.1
## v ggplot2 3.5.1 v tibble 3.2.1
## v lubridate 1.9.3 v tidyr 1.3.1
## v purrr 1.0.2
## -- Conflicts ------------------------------------------ tidyverse_conflicts() --
## x dplyr::collapse() masks nlme::collapse()
## x dplyr::filter() masks stats::filter()
## x dplyr::lag() masks stats::lag()
## x dplyr::select() masks jmvcore::select()
## i Use the conflicted package (<http://conflicted.r-lib.org/>) to force all conflicts to become err
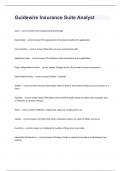
Read in the data
## # A tibble: 6 x 7
## Respnum Vestiging Tijd Burnout Conditie Sekse Leeftijd
## <dbl> <dbl> <dbl> <dbl> <dbl+lbl> <dbl+lbl> <dbl>
## 1 108 29 4 3.59 2 [yoga] 0 [man] 37.0
## 2 34 8 3 2.95 1 [fitness] 0 [man] 30.8
## 3 31 23 2 3.80 1 [fitness] 0 [man] 43.3
## 4 151 5 1 4.62 2 [yoga] 1 [vrouw] 42.8
## 5 2 15 6 2.32 1 [fitness] 0 [man] 45.4
## 6 264 30 4 3.34 3 [controle] 1 [vrouw] 45.4
Tranform data: correct variable types
1
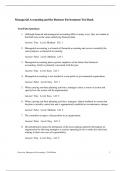
, Descriptive statistics
Check how sound the data is
##
## DESCRIPTIVES
##
## Descriptives
## ������������������������������������������������������������������������������������������������
## N Missing Mean Median SD Minimum Maximum
## ������������������������������������������������������������������������������������������������
## Burnout 2160 0 4.451827 4.296333 1.995177 0.6589023 10.000000
## Tijd 2160 0 3.507870 3.000000 2.293825 0.0000000 7.000000
## Conditie 2160 0
## Sekse 2160 0
## Leeftijd 2160 0 45.732342 46.061806 7.809702 18.2605629 67.153295
## ������������������������������������������������������������������������������������������������
##
##
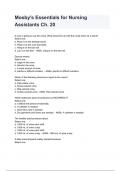
## FREQUENCIES
##
## Frequencies of Conditie
## ����������������������������������������������������
## Conditie Counts % of Total Cumulative %
## ����������������������������������������������������
## controle 717 33.19444 33.19444
## yoga 719 33.28704 66.48148
## fitness 724 33.51852 100.00000
## ����������������������������������������������������
##
##
## Frequencies of Sekse
## �������������������������������������������������
## Sekse Counts % of Total Cumulative %
## �������������������������������������������������
## vrouw 1075 49.76852 49.76852
## man 1085 50.23148 100.00000
## �������������������������������������������������
Inspection of these descriptive statistics:
• Burnout scores UBOS scale should not be lower than 1: remove lower-than-1 values
Now check how many participants we have in the data and how many participants have data for each
timepoint:
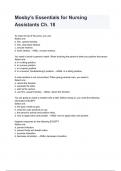
How many timepoints per participant?
2
knitr::opts_chunk$set(width.cutoff = 50)
knitr::opts_chunk$set(echo = FALSE)
Load in required libraries
## Welcome to emmeans.
## Caution: You lose important information if you filter this package's results.
## See '? untidy'
##
## Attaching package: 'jmvcore'
## The following objects are masked from 'package:base':
##
## endsWith, format, startsWith
## -- Attaching core tidyverse packages ------------------------ tidyverse 2.0.0 --
## v dplyr 1.1.4 v readr 2.1.5
## v forcats 1.0.0 v stringr 1.5.1
## v ggplot2 3.5.1 v tibble 3.2.1
## v lubridate 1.9.3 v tidyr 1.3.1
## v purrr 1.0.2
## -- Conflicts ------------------------------------------ tidyverse_conflicts() --
## x dplyr::collapse() masks nlme::collapse()
## x dplyr::filter() masks stats::filter()
## x dplyr::lag() masks stats::lag()
## x dplyr::select() masks jmvcore::select()
## i Use the conflicted package (<http://conflicted.r-lib.org/>) to force all conflicts to become err
Read in the data
## # A tibble: 6 x 7
## Respnum Vestiging Tijd Burnout Conditie Sekse Leeftijd
## <dbl> <dbl> <dbl> <dbl> <dbl+lbl> <dbl+lbl> <dbl>
## 1 108 29 4 3.59 2 [yoga] 0 [man] 37.0
## 2 34 8 3 2.95 1 [fitness] 0 [man] 30.8
## 3 31 23 2 3.80 1 [fitness] 0 [man] 43.3
## 4 151 5 1 4.62 2 [yoga] 1 [vrouw] 42.8
## 5 2 15 6 2.32 1 [fitness] 0 [man] 45.4
## 6 264 30 4 3.34 3 [controle] 1 [vrouw] 45.4
Tranform data: correct variable types
1
, Descriptive statistics
Check how sound the data is
##
## DESCRIPTIVES
##
## Descriptives
## ������������������������������������������������������������������������������������������������
## N Missing Mean Median SD Minimum Maximum
## ������������������������������������������������������������������������������������������������
## Burnout 2160 0 4.451827 4.296333 1.995177 0.6589023 10.000000
## Tijd 2160 0 3.507870 3.000000 2.293825 0.0000000 7.000000
## Conditie 2160 0
## Sekse 2160 0
## Leeftijd 2160 0 45.732342 46.061806 7.809702 18.2605629 67.153295
## ������������������������������������������������������������������������������������������������
##
##
## FREQUENCIES
##
## Frequencies of Conditie
## ����������������������������������������������������
## Conditie Counts % of Total Cumulative %
## ����������������������������������������������������
## controle 717 33.19444 33.19444
## yoga 719 33.28704 66.48148
## fitness 724 33.51852 100.00000
## ����������������������������������������������������
##
##
## Frequencies of Sekse
## �������������������������������������������������
## Sekse Counts % of Total Cumulative %
## �������������������������������������������������
## vrouw 1075 49.76852 49.76852
## man 1085 50.23148 100.00000
## �������������������������������������������������
Inspection of these descriptive statistics:
• Burnout scores UBOS scale should not be lower than 1: remove lower-than-1 values
Now check how many participants we have in the data and how many participants have data for each
timepoint:
How many timepoints per participant?
2