BUSI 1301 INTRODUCTION TO
BUSINESS (MGMT 105)
HOMEWORK 7 TEXAS A& M
UNIVERSITY
, lOMoAR cPSD| 19857451
1. Predicting wins (revisited).
a. Read in the baseball data set from Homework 4.
Ans. > baseball<-read.csv("baseball.csv")
b. Fit a linear regression model to predict Wins using HRs.
Ans. > model1<-lm(Wins~HRs, data=baseball)
> model1
Call:
lm(formula = Wins ~ HRs, data = baseball)
Coefficients:
(Intercept) HRs
54.2839 0.1624
> summary(model1)
Call:
lm(formula = Wins ~ HRs, data = baseball)
Residuals:
Min 1Q Median 3Q Max
-23.0003 -6.6780 0.4157 7.2763 22.9847
Coefficients:
Estimate Std. Error t value Pr(>|t|)
(Intercept) 54.28389 10.24539 5.298 1.23e-05 ***
HRs 0.16244 0.06112 2.658 0.0128 *
---
Signif. codes: 0 ‘***’ 0.001 ‘**’ 0.01 ‘*’ 0.05 ‘.’ 0.1 ‘ ’ 1
Residual standard error: 10.85 on 28 degrees of freedom
Multiple R-squared: 0.2015, Adjusted R-squared: 0.1729
F-statistic: 7.064 on 1 and 28 DF, p-value: 0.01285
The model shows that on an average the team will have 0.16 more wins for each additional
home runs.
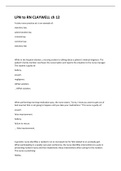
c. Calculate the Cook's Distance for each point and plot it.
Ans. > cook<-cooks.distance(model1)
> plot(cook, ylab = "Cook's Distance", main = "Cook's Distance Plot")
BUSINESS (MGMT 105)
HOMEWORK 7 TEXAS A& M
UNIVERSITY
, lOMoAR cPSD| 19857451
1. Predicting wins (revisited).
a. Read in the baseball data set from Homework 4.
Ans. > baseball<-read.csv("baseball.csv")
b. Fit a linear regression model to predict Wins using HRs.
Ans. > model1<-lm(Wins~HRs, data=baseball)
> model1
Call:
lm(formula = Wins ~ HRs, data = baseball)
Coefficients:
(Intercept) HRs
54.2839 0.1624
> summary(model1)
Call:
lm(formula = Wins ~ HRs, data = baseball)
Residuals:
Min 1Q Median 3Q Max
-23.0003 -6.6780 0.4157 7.2763 22.9847
Coefficients:
Estimate Std. Error t value Pr(>|t|)
(Intercept) 54.28389 10.24539 5.298 1.23e-05 ***
HRs 0.16244 0.06112 2.658 0.0128 *
---
Signif. codes: 0 ‘***’ 0.001 ‘**’ 0.01 ‘*’ 0.05 ‘.’ 0.1 ‘ ’ 1
Residual standard error: 10.85 on 28 degrees of freedom
Multiple R-squared: 0.2015, Adjusted R-squared: 0.1729
F-statistic: 7.064 on 1 and 28 DF, p-value: 0.01285
The model shows that on an average the team will have 0.16 more wins for each additional
home runs.
c. Calculate the Cook's Distance for each point and plot it.
Ans. > cook<-cooks.distance(model1)
> plot(cook, ylab = "Cook's Distance", main = "Cook's Distance Plot")