Amanda Mcintire
Section 2.3: One Quantitative Variable:
Measures of Spread
Example 1: Tips for a Pizza Delivery Person
A pizza delivery person recorded all of her tips (and other variables) over several shifts. She discusses the
results, and much more, on “Diary of a Pizza Girl” on the Slice website. The variable Tip in the PizzaGirl dataset
includes the 24 tips she recorded, and the values are also given below. Use technology to find the mean and
the standard deviation for these values. Give answers to two decimal places.
2, 4, 6, 2, 3, 3, 2, 0, 5, 3, 3, 4.5, 2.5, 8, 2, 2, 2, 3, 3, 3, 3, 5, 2, 0
Mean- 3.04 standard deviation- 1.79
Example 2: Percent of Body Fat in Men
The variable BodyFat in the BodyFat dataset gives the percent of weight made up of body fat for 100 men. For
this sample, the mean percent body fat is 18.6 and the standard deviation is 8.0. The distribution of the body
fat values is roughly symmetric and bell-shaped. (If you are on a computer, check this!)
a). Find an interval that is likely to contain roughly 95% of the data values.
18.6-8.0(2)= 2.6. 18.6+8.0(2)=34.6
b). The largest percent body fat of any man in the sample is 40.1 and the smallest is 3.7. Find and
interpret the z-score for each of these values. Which is relatively more extreme?
Z=40.1-18.6/ 8.0= 2.6. z= 3.7-18.6/8.0= -1.86
Quick Self-Quiz: Estimating Mean and Standard Deviation
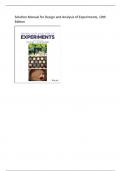
The histogram below shows the data for the quantitative variable Height for 355 students.
a). Estimate the mean and the standard deviation from the histogram.
Mean- 69 standard deviation - 64
b). Estimate the value of the maximum height for a person in the sample and use your estimated
values of mean and standard deviation to find and interpret an estimated z-score for this person’s height.
72-69/64= 0.04
Section 2.3: One Quantitative Variable:
Measures of Spread
Example 1: Tips for a Pizza Delivery Person
A pizza delivery person recorded all of her tips (and other variables) over several shifts. She discusses the
results, and much more, on “Diary of a Pizza Girl” on the Slice website. The variable Tip in the PizzaGirl dataset
includes the 24 tips she recorded, and the values are also given below. Use technology to find the mean and
the standard deviation for these values. Give answers to two decimal places.
2, 4, 6, 2, 3, 3, 2, 0, 5, 3, 3, 4.5, 2.5, 8, 2, 2, 2, 3, 3, 3, 3, 5, 2, 0
Mean- 3.04 standard deviation- 1.79
Example 2: Percent of Body Fat in Men
The variable BodyFat in the BodyFat dataset gives the percent of weight made up of body fat for 100 men. For
this sample, the mean percent body fat is 18.6 and the standard deviation is 8.0. The distribution of the body
fat values is roughly symmetric and bell-shaped. (If you are on a computer, check this!)
a). Find an interval that is likely to contain roughly 95% of the data values.
18.6-8.0(2)= 2.6. 18.6+8.0(2)=34.6
b). The largest percent body fat of any man in the sample is 40.1 and the smallest is 3.7. Find and
interpret the z-score for each of these values. Which is relatively more extreme?
Z=40.1-18.6/ 8.0= 2.6. z= 3.7-18.6/8.0= -1.86
Quick Self-Quiz: Estimating Mean and Standard Deviation
The histogram below shows the data for the quantitative variable Height for 355 students.
a). Estimate the mean and the standard deviation from the histogram.
Mean- 69 standard deviation - 64
b). Estimate the value of the maximum height for a person in the sample and use your estimated
values of mean and standard deviation to find and interpret an estimated z-score for this person’s height.
72-69/64= 0.04