
• ¿Documento equivocado? Cámbialo gratis
  • Escrito por estudiantes que aprobaron
  • Inmediatamente disponible después del pago
  • Leer en línea o como PDF
Vender
¿Dónde estudias?
Tu idioma
Document preview thumbnail
Vista previa 1 fuera de 3 páginas
Examen

Descriptive Statistics

Document preview thumbnail
Vista previa 1 fuera de 3 páginas

Descriptive statistics - answer-Allows you to Understand data form/ structure, Control for errors, and select appropriate analysis expected - answer-Where possible, identify ______ characteristics of data, such as temp should be between these celsius central tendency, variability, shape - answer-Univariate statistics describe the _____ ____ , the _____ and the ____ of a set of numbers central tendency - answer-Measures of ____ ____ are mean, mode, and median robust - answer-median is considered the ____ estimator Range - answer-min-max Interquartile range - answer-(25%-75%) variance - answer-The average of the squared differences from the Mean. Standard deviation - answer-a measure of how spread out numbers are, the square root of Variance Coefficient of variation - answer-expresses the standard deviation as a percentage of what is being measured relative to the sample or population mean. Population variance - answer-σ2 =1/n n∑i=1 (xi- µ)2 sample variance - answer-s2 =1/n-1 n∑i=1 (xi- x)2 population standard deviation - answer-σ=σ2^1/2 =(1/n n∑i=1 (xi- µ)2)1/2 sample standard deviation - answer-s=s2^1/2=(1/n-1n∑i=1 (xi- x)2)1/2 skewness - answer-measures of the asymmetry of a distribution of values, indicates potential bias in mean Kurtosis - answer-measure of the peakedness of a distribution of values, concentration of values around the center platykurtic - answer-kurtosis=1.8 normal - answer-kurtosis=3 leptokurtic - answer-kurtosis=4.2 enumerative plots - answer-plots that show every observation summary plots - answer-generalizes the data into a simplified representation histograms - answer-count of obervations within bins, used to depict the probability distribution of data density plots - answer-estimation of probability distribution function of data, smoothed rep of a histogram QQ plot - answer-Plot of the quantile values from a set of data against the equivalent quantiles from a normal distribution, visual examination of normality of data 1:1 - answer-if the data of a qq plot falls on the ____ line, they may be assumed to be normal form, direction, strength - answer-bivariate statistics explore the ___, ____, and ___ of the relationship Covariance - answer-Measure of the extent to which two variables vary together. Results depend on the units of the data Pearson's correlation coefficient (r) - answer-Normalizes covariance (scale of -1 to 1). Allows for comparison between variables of different magnitudes t-statistic, t-distribution - answer-Significance of correlation can be tested by calculating the______ and comparing against a _______ with df = n − 2 Correlation - answer-_________ reflects the strength and direction of a relationship, but not the slope linear relationship - answer-Standard correlation coefficient (Pearson's r) assumes a _____ _______ Non-linear relationships - answer-can be tested with Spearman's Rank or Kendall's Rank correlation contingency table - answer-Association with categorical variables can be assessed with a _______ ____, Lists the frequency of occurences of each pairwise combination of categories Chi-squared test - answer-Significance of association can be tested with a Null hypothesis - answer-is that values are equally distributed among categories variable - answer-an object with a name and a value that may be modified Operators - answer-+ - / * command - answer-generally composed of one or more functions and operators acting on one or more objects Vector - answer-1-dimensional, same mode Matrix - answer-2-dimensional, same mode Array - answer-Multi-dimensional, same mode Data frame - answer-2-dimensional with different modes List - answer-set of other objects, Frequently output from R functions σ (sigma) - answer-Standard Deviation sign μ (mu) - answer-mean sign xi - ans

Vista previa del contenido

1
1


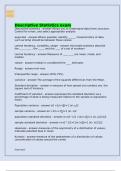
Descriptive Statistics exam
Descriptive statistics - answer-Allows you to Understand data form/ structure,
Control for errors, and select appropriate analysis

expected - answer-Where possible, identify ______ characteristics of data,
such as temp should be between these celsius

central tendency, variability, shape - answer-Univariate statistics describe
the _____ ____ , the _____ and the ____ of a set of numbers

central tendency - answer-Measures of ____ ____ are mean, mode, and
median

robust - answer-median is considered the ____ estimator

Range - answer-min-max

Interquartile range - answer-(25%-75%)

variance - answer-The average of the squared differences from the Mean.

Standard deviation - answer-a measure of how spread out numbers are, the
square root of Variance

Coefficient of variation - answer-expresses the standard deviation as a
percentage of what is being measured relative to the sample or population
mean.

Population variance - answer-σ2 =1/n n∑i=1 (xi- µ)2

sample variance - answer-s2 =1/n-1 n∑i=1 (xi- x)2

population standard deviation - answer-σ=σ2^1/2 =(1/n n∑i=1 (xi- µ)2)1/2

sample standard deviation - answer-s=s2^1/2=(1/n-1n∑i=1 (xi- x)2)1/2

skewness - answer-measures of the asymmetry of a distribution of values,
indicates potential bias in mean

Kurtosis - answer-measure of the peakedness of a distribution of values,
concentration of values around the center


[Type here]

Información del documento

Subido en
3 de septiembre de 2024
Número de páginas
3
Escrito en
2024/2025
Tipo
Examen
Contiene
Preguntas y respuestas
$8.49

¿Documento equivocado? Cámbialo gratis Dentro de los 14 días posteriores a la compra y antes de descargarlo, puedes elegir otro documento. Puedes gastar el importe de nuevo.
Escrito por estudiantes que aprobaron
Inmediatamente disponible después del pago
Leer en línea o como PDF

Seller avatar
Los indicadores de reputación están sujetos a la cantidad de artículos vendidos por una tarifa y las reseñas que ha recibido por esos documentos. Hay tres niveles: Bronce, Plata y Oro. Cuanto mayor reputación, más podrás confiar en la calidad del trabajo del vendedor.
TOPDOCTOR
5.0
(1)
Vendido
10
Seguidores
5
Artículos
3387
Última venta
1 año hace


Por qué los estudiantes eligen Stuvia

Creado por compañeros estudiantes, verificado por reseñas

Calidad en la que puedes confiar: escrito por estudiantes que aprobaron y evaluado por otros que han usado estos resúmenes.

¿No estás satisfecho? Elige otro documento

¡No te preocupes! Puedes elegir directamente otro documento que se ajuste mejor a lo que buscas.

Paga como quieras, empieza a estudiar al instante

Sin suscripción, sin compromisos. Paga como estés acostumbrado con tarjeta de crédito y descarga tu documento PDF inmediatamente.

Student with book image

“Comprado, descargado y aprobado. Así de fácil puede ser.”

Alisha Student

Preguntas frecuentes
