UNISA » 2024 > STA1501-24-Y > Welcome Message > Assessment6
Quiz
OSCAR THE TUTOR
+27737560989
N . for FAC MAC ECS DSC TAX QMI FIN
Time left 25:22:25 INV BNU STA tutorials
Question 1
Answer saved
Marked out of 4.00
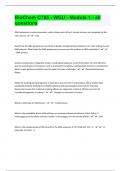
Assume that a mean length of a working week for a population of workers has
been previously reported as 39.2 hours with a population standard deviation of
4.8. Suppose a current sample of 112 workers provides a sample mean of 38.5
hours. The analyst wants to test the following hypotheses:
The null hypothesis Ho: | = 39.2 against the alternative hypothesis Hy: p %
39.2.
The pvalue is
Select one:
@® 1. 0.0668.
O 2. 0.1236.
O3 07
O 4. 0.4536.
O 5. 0.0618.
Clear
my choice
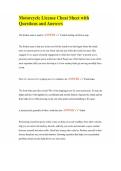
,Sales personnel for a supermarket submit weekly reports listing the customers contacts made during the
week. A sample of 66 weekly reports showed a mean of 19.5 and a sample standard deviation of 5.2
customer contacts per week. The 99% confidence interval for the population mean number of the weekly
customer contacts is
Select one:
O 1. (19.5; 1.6988).
O 2. (1.677; 4.873).
® 3. (17.8012 21.1988).
O 4 (2083 4.2169).
O 5. (18.2455; 20.7545).
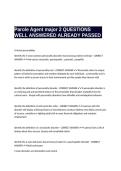
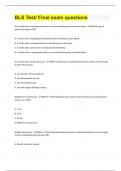
,A researcher wants to use the linear regression to determine whether there is a relationship between X and
Y using the data below:
The coefficient of correlation is
Select one:
® 1. 0.6606.
O 2. 03198,
O 3. 0.0660.
O 4 075
O 5 0.6073.
, UNISA » 2024 > STA1501-24-Y > Welcome Message > Assessment6
quiz
Time left 23:20:36
Question 4
Answer saved
Marked out of 3.00
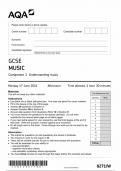
The following data represent the hourly wage rates (rand per hour) for
10 employees of a company:
‘22‘24 17‘21‘18‘16‘19 21‘20‘22‘
Which one of the following statements is incorrect?
Select one:
@ 1. The value that represents the first quartile Q; (or the percentile Pys) is
17.75.
O 2. The value that represents the second quartile Q, (or percentile Pso) is
20.5.
O 3. The position of the first quartile Q; (or the percentile Pys) is 2.75.
O 4. Theinterquartile range is 4.
O 5. The variance of wage rates is 6.2222.
Clear
my choice
Quiz
OSCAR THE TUTOR
+27737560989
N . for FAC MAC ECS DSC TAX QMI FIN
Time left 25:22:25 INV BNU STA tutorials
Question 1
Answer saved
Marked out of 4.00
Assume that a mean length of a working week for a population of workers has
been previously reported as 39.2 hours with a population standard deviation of
4.8. Suppose a current sample of 112 workers provides a sample mean of 38.5
hours. The analyst wants to test the following hypotheses:
The null hypothesis Ho: | = 39.2 against the alternative hypothesis Hy: p %
39.2.
The pvalue is
Select one:
@® 1. 0.0668.
O 2. 0.1236.
O3 07
O 4. 0.4536.
O 5. 0.0618.
Clear
my choice
,Sales personnel for a supermarket submit weekly reports listing the customers contacts made during the
week. A sample of 66 weekly reports showed a mean of 19.5 and a sample standard deviation of 5.2
customer contacts per week. The 99% confidence interval for the population mean number of the weekly
customer contacts is
Select one:
O 1. (19.5; 1.6988).
O 2. (1.677; 4.873).
® 3. (17.8012 21.1988).
O 4 (2083 4.2169).
O 5. (18.2455; 20.7545).
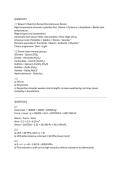
,A researcher wants to use the linear regression to determine whether there is a relationship between X and
Y using the data below:
The coefficient of correlation is
Select one:
® 1. 0.6606.
O 2. 03198,
O 3. 0.0660.
O 4 075
O 5 0.6073.
, UNISA » 2024 > STA1501-24-Y > Welcome Message > Assessment6
quiz
Time left 23:20:36
Question 4
Answer saved
Marked out of 3.00
The following data represent the hourly wage rates (rand per hour) for
10 employees of a company:
‘22‘24 17‘21‘18‘16‘19 21‘20‘22‘
Which one of the following statements is incorrect?
Select one:
@ 1. The value that represents the first quartile Q; (or the percentile Pys) is
17.75.
O 2. The value that represents the second quartile Q, (or percentile Pso) is
20.5.
O 3. The position of the first quartile Q; (or the percentile Pys) is 2.75.
O 4. Theinterquartile range is 4.
O 5. The variance of wage rates is 6.2222.
Clear
my choice