
Topic: Psychology- Correlations
Key points/ Notes/Diagrams:
Main Ideas/
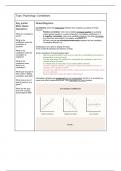
Correlations show the relationship between two variables (e.g taste of kinder
Questions: buenos)
- Positive correlation: when two variables increase together (e.g playing
What do correlations violent games results in a violent character). Correlation coefficient is +1.
show? - A negative correlation: when one variable increases, the other decreases
(e.g exercises and weight). Correlation coefficient is -1.
What is the - Or there may be no correlation/relationship between the two variables.
coefficient when the Correlation efficient is 0.
correlation is
positive? Scattergrams are used to display the data.
A line of best fit indicates the direction of data.
What is the
coefficient when the Using correlations for psychological data:
correlation is - Quick and economical to carry out (no need for a controlled environment or
negative? manipulation of environment).
- Can be used when it's unethical to manipulate the variables to see if one
What is the variable affects the other.
coefficient when - If a relationship is found then it can justify further research.
there is no - Another untested variable is causing the relationship between the two co-
correlation? variables (3rd variable problem)
- We can't say caffeine causes anxiety- maybe people who work longer hours
What type of graph is are more anxious
best used to display - Doesn’t determine cause and effect relationships.
correlation and data?
Correlation variables are measured and not manipulated. No DV or IV involved (no
What does a line of cause and effect relationship found. Only association is found instead.
best fit used for in a
graph?
What are the pros
and cons of using
psychological data?

