CHAPTER 2 QMB 3200 UCF PRACTICE QUESTIONS AND ANSWERS 2024
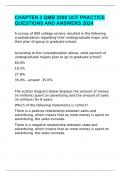
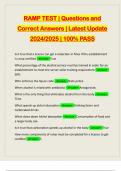
A survey of 800 college seniors resulted in the following crosstabulation regarding their undergraduate major and their plan of going to graduate school.
According to the crosstabulation above, what percent of undergraduate majors plan to go to graduate school?
65.0%
19.3%
27.8%
35.0% - answer 35.0%
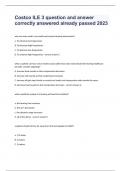
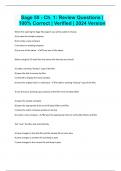
The scatter diagram below displays the amount of money
(in millions) spent on advertising and the amount of sales
(in millions) for 8 years.
Which of the following statements is correct?
There is a positive relationship between sales and advertising, which means that as more money is spent on
advertising, the sales increase.
There is a negative relationship between sales and advertising, which means that as more money is spent on
advertising, the sales increase. There is a negative relationship between sales and advertising, which means that as more money is spent on
advertising, the sales decrease.
There is a positive relationship between sales and advertising, which means that as more money is spent on
advertising, the sales decrease. - answer There is a positive relationship between sales and advertising, which means that as more money is spent on advertising,
the sales increase.
Before drawing any conclusions about the relationship between two variables shown in a crosstabulation, you should:
construct a dot plot and look for significant gaps.
investigate whether any hidden variables could affect the
conclusions.
construct a scatter diagram and find the trendline.
develop a relative frequency distribution. - answer investigate whether any hidden variables could affect the
conclusions.
The difference between the lower class limits of adjacent classes provides the:
class width.
number of classes.
class limits.
class midpoint. - answer class width. In a crosstabulation:
both variables can be either categorical or quantitative.
both variables must be categorical.
both variables must be quantitative.
one variable must be categorical and the other must be quantitative. - answer both variables can be either categorical or quantitative.
The following data shows the price of PAO, Inc. stock over
the last 8 months.
Which type of graph would be appropriate for displaying this information?
Scatter diagram
Histogram
Side-by-side bar chart
Stacked bar chart - answer The distribution of exam scores is skewed to the left.
The relative frequency of a class is computed by:
dividing the frequency of the class by the sample size.
dividing the midpoint of the class by the sample size.
dividing the frequency of the class by the midpoint.
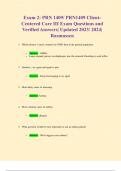
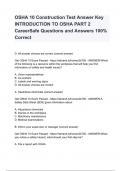
A survey of 800 college seniors resulted in the following crosstabulation regarding their undergraduate major and their plan of going to graduate school.
According to the crosstabulation above, what percent of undergraduate majors plan to go to graduate school?
65.0%
19.3%
27.8%
35.0% - answer 35.0%
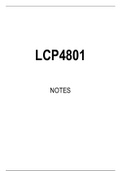
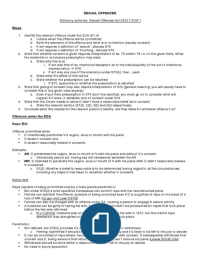
The scatter diagram below displays the amount of money
(in millions) spent on advertising and the amount of sales
(in millions) for 8 years.
Which of the following statements is correct?
There is a positive relationship between sales and advertising, which means that as more money is spent on
advertising, the sales increase.
There is a negative relationship between sales and advertising, which means that as more money is spent on
advertising, the sales increase. There is a negative relationship between sales and advertising, which means that as more money is spent on
advertising, the sales decrease.
There is a positive relationship between sales and advertising, which means that as more money is spent on
advertising, the sales decrease. - answer There is a positive relationship between sales and advertising, which means that as more money is spent on advertising,
the sales increase.
Before drawing any conclusions about the relationship between two variables shown in a crosstabulation, you should:
construct a dot plot and look for significant gaps.
investigate whether any hidden variables could affect the
conclusions.
construct a scatter diagram and find the trendline.
develop a relative frequency distribution. - answer investigate whether any hidden variables could affect the
conclusions.
The difference between the lower class limits of adjacent classes provides the:
class width.
number of classes.
class limits.
class midpoint. - answer class width. In a crosstabulation:
both variables can be either categorical or quantitative.
both variables must be categorical.
both variables must be quantitative.
one variable must be categorical and the other must be quantitative. - answer both variables can be either categorical or quantitative.
The following data shows the price of PAO, Inc. stock over
the last 8 months.
Which type of graph would be appropriate for displaying this information?
Scatter diagram
Histogram
Side-by-side bar chart
Stacked bar chart - answer The distribution of exam scores is skewed to the left.
The relative frequency of a class is computed by:
dividing the frequency of the class by the sample size.
dividing the midpoint of the class by the sample size.
dividing the frequency of the class by the midpoint.