Rubi Luneta
2081276
Tilburg University
Inhoudsopgave SPSS MTO-C
SPSS Practical 1 - ANOVA & Pearson Correlation
Practical 1 - Assignment 1: The Basics (Syntax & Descriptives) blz. 2-4
Practical 1 - Assignment 2: ANOVA blz. 5-7
Practical 1 - Assignment 3: Pearson Correlation blz. 8-10
SUMMARY SPSS Practical 1 - ANOVA & Pearson Correlation blz. 11
SPSS Practical 2 - Simple Linear Regression
Practical 2 - Assignment 1: Data Preparation blz. 12-15
Practical 2 - Assignment 2: Linear Regression blz. 16-17
Practical 2 - Assignment 3: Linear Regression, Predictions and Residuals blz. 18-20
Practical 2 - Assignment 4: Linear Regression, Explained Variance blz. 21-23
SUMMARY SPSS Practical 2 - Simple Linear Regression blz. 24
SPSS Practical 3 - Multiple Linear Regression & Logistic
Regression
Practical 3 - Assignment 1: Sequential Regression blz. 25-28
Practical 3 - Assignment 2: Path Model blz. 29-31
Practical 3 - Assignment 3: Logistic Regression blz. 32-34
SUMMARY SPSS Practical 3 - Multiple Linear Regression & Logistic Regression blz. 35
1
, SPSS Practical 1 - ANOVA & Pearson Correlation
Practical 1 - Assignment 1: The Basics (Syntax & Descriptives)
When you've completed this practical, you 1) know how to check the assumption of an ANOVA, 2)
can request and interpret an ANOVA, 3) know how to check the assumptions of a linear
Correlation, 4) can request and interpret a Pearson Correlation.
In this assignment you will analyze the following data le: Innovative Performance.sav
Please download the le and open it in SPSS.
Click Next when you’re ready.
Question 1
The Innovative Performance data le contains simulated data for 1275 employees, working in 3
di erent companies. The dependent variable, the variable we are most interested in to explain,
is Individual Innovative Performance and is called iip in the data le.
Several other variables are included in the le, measuring a number of characteristics of the
employees such as their age, gender, educational level, experience on projects, a number of
skills, and the company that they work for.
In SPSS, you can switch between two views: The Data View that shows the raw data and
the Variable View providing information on the variables in the data set. You can use the tabs at
the bottom of the screen to switch between these views.
Take a minute to get yourself familiar with the variables in this data le, especially with the
variables Individual Innovative Performance and Company.
Based on the measurement level of the variables, which method (that was discussed in the
lectures), would be most appropriate to analyze the relation between Individual Innovative
Performance (Y) and the Company (X) that someone works for?
Answer ANOVA
Throughout all of the following assignments, you should record the syntax of every action you
perform with the SPSS Syntax Editor.
The bene t of using syntax is that it provides a precise history of how the data was analyzed.
Always aim to keep your data le and your syntax le well-organized. This way you never have to
save any output, because you can always recreate it as needed by having SPSS perform all the
syntax that you saved.
There are two ways to create a new syntax le:
• In SPSS, navigate to File → New → Syntax
• Before performing any analysis, instead of clicking the Ok button, click the Paste button
After starting a new syntax le, using the paste button for subsequent analyses will add the
commands to the bottom of the original le. You do not have to make a new le for each analysis.
Clicking Paste will close the dialog window without running your command. Instead, your
command has been pasted to the syntax le. In order to run the commands you created, select
the piece of syntax in the syntax le and run it (for example by pressing Ctrl + R).
Question 2
Before actually performing any analysis on your data, it is always a good idea to rst take a look
at the data and its descriptive statistics.
Generate the frequency distribution for the variable Company (Analyze > Descriptive Statistics >
Frequencies).
Remember to use the Paste button and run the syntax from the syntax le.
How many respondents work for organization 2?
FREQUENCIES VARIABLES=company
/ORDER=ANALYSIS.
2
ff fi fi fi fi fifi fi fififi fi fi fi fi fi fi fi
, Answer 361
Question 3
For continuous variables, the Frequency function is often not very useful, because many di erent
scores are possible. If many di erent values are possible, or the sample is not very big, each
respondent will have its own unique value with a frequency of one. In such cases, a better
alternative is using summary statistics for these variables, such as the mean, median, and
variance.
Many di erent summary statistics for variables can be obtained using the Descriptives function.
Let's obtain the mean, standard deviation, minimum score, and maximum score for the
variable iip (Analyze > Descriptive Statistics > Descriptives).
The listed statistics should all be given in the output with the default settings. If one or more of
these statistics are missing, navigate to the Statistics tab in the descriptive screen and make sure
all relevant boxes are ticked before pasting your syntax.
What is the standard deviation of the variable iip? (round to one decimal place, i.e. xx.x)
DESCRIPTIVES VARIABLES=iip
/STATISTICS=MEAN STDDEV MIN MAX.
Answer 16.5
Question 4
Using the Descriptives function of SPSS we saw one way to obtain the mean for a variable. A
second way is by using the Means function.
Let's use the Means function to nd the mean age of our sample (Analyze > Compare Means).
Remember to keep pasting your analysis and occasionally save your syntax le.
What is the mean age in this sample? (round to two decimal places, i.e. xx.xx)
MEANS TABLES=age
/CELLS=MEAN COUNT STDDEV.
Answer 42.38
3
ff ff fi fi ff
, Question 5
Of course, the Means function is not only there to provide the mean for one variable. As you've
probably noticed, in the dialog window in the Means function also has the possibility to provide an
additional, independent variable.
Let’s try this! Keep the variable age in the list for the dependent variables and add the variable
company to the list of independent variables (in the box called layer 1 of 1). Paste and run the
syntax.
As you can see, for a categorical independent variable, it now computes the mean for each
category (in this case the three di erent companies) separately.
What is the mean age in company 1? (rounded to two decimal places, i.e. xx.xx)
MEANS TABLES=age BY company
/CELLS=MEAN COUNT STDDEV.
Answer 42.22
Question 6
Let's take another look at the SPSS output we generated in the previous step; the mean values
for age separately for the three companies.
Can we, based on this information, say anything about the di erences in the entire population
under study?
(You may assume that these are very big companies and we have only observed a small part of
their employees.)
Answer No - We are only looking at sample data, and we need further tests to say anything about
the population.
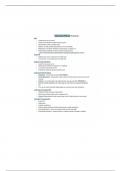
Summary Practical 1 - Assignment 1: The Basics (Syntax & Descriptives)
- ANOVA wordt gebruikt om de gemiddelden van twee of meer groepen te vergelijken. De
afhankelijke variabele moet een kwantitatieve variabele zijn, zoals een score, een tijd of een
hoeveelheid. De onafhankelijke variabele kan een categorische variabele zijn met twee of meer
niveaus.
- Correlatie wordt gebruikt om de sterkte en richting van de lineaire relatie tussen twee
variabelen te meten. De afhankelijke variabele moet een kwantitatieve variabele zijn, zoals een
score, een tijd of een hoeveelheid. De onafhankelijke variabele kan ook een kwantitatieve
variabele zijn.
- Syntax: File → New → Syntax
- Frequencies: Analyze > Descriptive Statistics > Frequencies
- Continue variabelen zijn numerieke variabelen die een oneindig aantal waarden binnen een
bepaald bereik kunnen aannemen. Ze worden ook wel intervalvariabelen genoemd. Deze
variabelen kunnen elk numeriek punt binnen een bepaald interval aannemen en kunnen
worden gemeten met behulp van schaalniveaus.
- Descriptives: Analyze > Descriptive Statistics > Descriptives > Options
✓ mean *, standard deviation, minimum score, and maximum score
- Means: Analyze > Compare Means and Proportions > Means
- Can we, based on this information, say anything about the di erences in the entire population
under study? No - We are only looking at sample data, and we need further tests to say
anything about the population.
4
ff ff
2081276
Tilburg University
Inhoudsopgave SPSS MTO-C
SPSS Practical 1 - ANOVA & Pearson Correlation
Practical 1 - Assignment 1: The Basics (Syntax & Descriptives) blz. 2-4
Practical 1 - Assignment 2: ANOVA blz. 5-7
Practical 1 - Assignment 3: Pearson Correlation blz. 8-10
SUMMARY SPSS Practical 1 - ANOVA & Pearson Correlation blz. 11
SPSS Practical 2 - Simple Linear Regression
Practical 2 - Assignment 1: Data Preparation blz. 12-15
Practical 2 - Assignment 2: Linear Regression blz. 16-17
Practical 2 - Assignment 3: Linear Regression, Predictions and Residuals blz. 18-20
Practical 2 - Assignment 4: Linear Regression, Explained Variance blz. 21-23
SUMMARY SPSS Practical 2 - Simple Linear Regression blz. 24
SPSS Practical 3 - Multiple Linear Regression & Logistic
Regression
Practical 3 - Assignment 1: Sequential Regression blz. 25-28
Practical 3 - Assignment 2: Path Model blz. 29-31
Practical 3 - Assignment 3: Logistic Regression blz. 32-34
SUMMARY SPSS Practical 3 - Multiple Linear Regression & Logistic Regression blz. 35
1
, SPSS Practical 1 - ANOVA & Pearson Correlation
Practical 1 - Assignment 1: The Basics (Syntax & Descriptives)
When you've completed this practical, you 1) know how to check the assumption of an ANOVA, 2)
can request and interpret an ANOVA, 3) know how to check the assumptions of a linear
Correlation, 4) can request and interpret a Pearson Correlation.
In this assignment you will analyze the following data le: Innovative Performance.sav
Please download the le and open it in SPSS.
Click Next when you’re ready.
Question 1
The Innovative Performance data le contains simulated data for 1275 employees, working in 3
di erent companies. The dependent variable, the variable we are most interested in to explain,
is Individual Innovative Performance and is called iip in the data le.
Several other variables are included in the le, measuring a number of characteristics of the
employees such as their age, gender, educational level, experience on projects, a number of
skills, and the company that they work for.
In SPSS, you can switch between two views: The Data View that shows the raw data and
the Variable View providing information on the variables in the data set. You can use the tabs at
the bottom of the screen to switch between these views.
Take a minute to get yourself familiar with the variables in this data le, especially with the
variables Individual Innovative Performance and Company.
Based on the measurement level of the variables, which method (that was discussed in the
lectures), would be most appropriate to analyze the relation between Individual Innovative
Performance (Y) and the Company (X) that someone works for?
Answer ANOVA
Throughout all of the following assignments, you should record the syntax of every action you
perform with the SPSS Syntax Editor.
The bene t of using syntax is that it provides a precise history of how the data was analyzed.
Always aim to keep your data le and your syntax le well-organized. This way you never have to
save any output, because you can always recreate it as needed by having SPSS perform all the
syntax that you saved.
There are two ways to create a new syntax le:
• In SPSS, navigate to File → New → Syntax
• Before performing any analysis, instead of clicking the Ok button, click the Paste button
After starting a new syntax le, using the paste button for subsequent analyses will add the
commands to the bottom of the original le. You do not have to make a new le for each analysis.
Clicking Paste will close the dialog window without running your command. Instead, your
command has been pasted to the syntax le. In order to run the commands you created, select
the piece of syntax in the syntax le and run it (for example by pressing Ctrl + R).
Question 2
Before actually performing any analysis on your data, it is always a good idea to rst take a look
at the data and its descriptive statistics.
Generate the frequency distribution for the variable Company (Analyze > Descriptive Statistics >
Frequencies).
Remember to use the Paste button and run the syntax from the syntax le.
How many respondents work for organization 2?
FREQUENCIES VARIABLES=company
/ORDER=ANALYSIS.
2
ff fi fi fi fi fifi fi fififi fi fi fi fi fi fi fi
, Answer 361
Question 3
For continuous variables, the Frequency function is often not very useful, because many di erent
scores are possible. If many di erent values are possible, or the sample is not very big, each
respondent will have its own unique value with a frequency of one. In such cases, a better
alternative is using summary statistics for these variables, such as the mean, median, and
variance.
Many di erent summary statistics for variables can be obtained using the Descriptives function.
Let's obtain the mean, standard deviation, minimum score, and maximum score for the
variable iip (Analyze > Descriptive Statistics > Descriptives).
The listed statistics should all be given in the output with the default settings. If one or more of
these statistics are missing, navigate to the Statistics tab in the descriptive screen and make sure
all relevant boxes are ticked before pasting your syntax.
What is the standard deviation of the variable iip? (round to one decimal place, i.e. xx.x)
DESCRIPTIVES VARIABLES=iip
/STATISTICS=MEAN STDDEV MIN MAX.
Answer 16.5
Question 4
Using the Descriptives function of SPSS we saw one way to obtain the mean for a variable. A
second way is by using the Means function.
Let's use the Means function to nd the mean age of our sample (Analyze > Compare Means).
Remember to keep pasting your analysis and occasionally save your syntax le.
What is the mean age in this sample? (round to two decimal places, i.e. xx.xx)
MEANS TABLES=age
/CELLS=MEAN COUNT STDDEV.
Answer 42.38
3
ff ff fi fi ff
, Question 5
Of course, the Means function is not only there to provide the mean for one variable. As you've
probably noticed, in the dialog window in the Means function also has the possibility to provide an
additional, independent variable.
Let’s try this! Keep the variable age in the list for the dependent variables and add the variable
company to the list of independent variables (in the box called layer 1 of 1). Paste and run the
syntax.
As you can see, for a categorical independent variable, it now computes the mean for each
category (in this case the three di erent companies) separately.
What is the mean age in company 1? (rounded to two decimal places, i.e. xx.xx)
MEANS TABLES=age BY company
/CELLS=MEAN COUNT STDDEV.
Answer 42.22
Question 6
Let's take another look at the SPSS output we generated in the previous step; the mean values
for age separately for the three companies.
Can we, based on this information, say anything about the di erences in the entire population
under study?
(You may assume that these are very big companies and we have only observed a small part of
their employees.)
Answer No - We are only looking at sample data, and we need further tests to say anything about
the population.
Summary Practical 1 - Assignment 1: The Basics (Syntax & Descriptives)
- ANOVA wordt gebruikt om de gemiddelden van twee of meer groepen te vergelijken. De
afhankelijke variabele moet een kwantitatieve variabele zijn, zoals een score, een tijd of een
hoeveelheid. De onafhankelijke variabele kan een categorische variabele zijn met twee of meer
niveaus.
- Correlatie wordt gebruikt om de sterkte en richting van de lineaire relatie tussen twee
variabelen te meten. De afhankelijke variabele moet een kwantitatieve variabele zijn, zoals een
score, een tijd of een hoeveelheid. De onafhankelijke variabele kan ook een kwantitatieve
variabele zijn.
- Syntax: File → New → Syntax
- Frequencies: Analyze > Descriptive Statistics > Frequencies
- Continue variabelen zijn numerieke variabelen die een oneindig aantal waarden binnen een
bepaald bereik kunnen aannemen. Ze worden ook wel intervalvariabelen genoemd. Deze
variabelen kunnen elk numeriek punt binnen een bepaald interval aannemen en kunnen
worden gemeten met behulp van schaalniveaus.
- Descriptives: Analyze > Descriptive Statistics > Descriptives > Options
✓ mean *, standard deviation, minimum score, and maximum score
- Means: Analyze > Compare Means and Proportions > Means
- Can we, based on this information, say anything about the di erences in the entire population
under study? No - We are only looking at sample data, and we need further tests to say
anything about the population.
4
ff ff