2023-2024, Block 1 GW4003MV. Advanced Research Methods
WEEK 3
Yes or no? Proportions and probabilities
Inhoud
Knowledge clips................................................................................................................................................2
Knowledge clip 3.1: Logistic regression.....................................................................................................2
Knowledge clip 3.2: OLS vs. Logistic regression.........................................................................................4
Lecture (15 sept)...............................................................................................................................................7
Part 1. OLS and logistic regression................................................................................................................7
Part 2. Logistic regression results..................................................................................................................9
Part 3. Table 2: Fallacy.................................................................................................................................12
Part 4. Roles of theory................................................................................................................................15
Workgroup meeting........................................................................................................................................16
Homework assignment...............................................................................................................................16
Research case 1: Interpreting study results using logistic regression......................................................16
Research case 2: Calculating and interpreting odds ratios......................................................................23
Literature........................................................................................................................................................26
Wheelan: Chapter 8: The central limit theorem.....................................................................................27
Westreich, Greenland (2013). The Table 2 Fallacy: Presenting and interpreting confounder and modifier
coefficients..............................................................................................................................................29
Viera (2008). Odds Ratios and Risk Ratios: What’s the difference and why does it matter?...................31
1
,2023-2024, Block 1 GW4003MV. Advanced Research Methods
Knowledge clips
Knowledge clip 3.1: Logistic regression
The regression type you choose solely depends on the outcome variable of interest. You use a logistic
regression when the outcome variable is dichotomous (only 2 potential values).
Example: RQ: How likely is it that someone gets injured after jumping off a pile of paper?
Outcome = Y = Injured (yes or no)
The difficulty with this RQ: there is no
average probability that someone gets
injured, because that probability
depends on how high the pile of paper
is. Another difficulty: normally we don’t
observe probabilities on the individual
level.
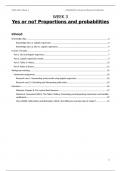
If you record individual observations an infinite
amount of times, the observed proportions will
start taking this S-/sigmoid-shape. In practice this
often isn’t feasable.
If this is not a feasable strategy, how can you still
answer the RQ?: By moving away from
proportions to the estimation of probabilities by
using a regression.
Estimate probability by using a logistic regression:
Sample size = 1000.
QUESTIONS:
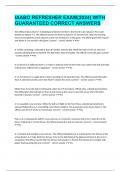
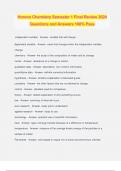
What will the plotted data on height (of pile of paper) and injury (yes or no) look like?
The observations are either centered at 0 (no/not injured) or at 1 (yes/injured).
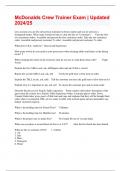
Why is an OLS regression not useful for answering the research question?
When we fit an OLS regression to this data, it is directly clear that this doesn’t capture the observations.
There is a large difference between the fitted
regression curve and the observation points, which
means there is a large error term which isn’t desirable.
Also, this regression curve suggests that it is possible
to have an outcome that falls inbetween 0 and 1 / yes
2
,2023-2024, Block 1 GW4003MV. Advanced Research Methods
or no, or even an outcome that falls lower than 0 or higher than 1 which isn’t possible with probabilities
(they always fall within the 0 – 1 range).
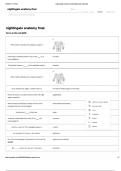
We need a S- or sigmoid-curve that mimics the proportion of volunteers hurting themselves when
jumping of a pile of paper of different heights. That is exactly what a logistic regression does; it models
the probability of the outcome of interest (Y).
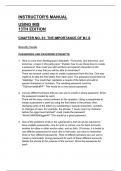
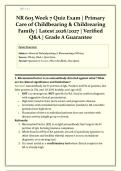
Please study this slide . It helps you how an
extended research equation and a DAG are related.
3
, 2023-2024, Block 1 GW4003MV. Advanced Research Methods
Knowledge clip 3.2: OLS vs. Logistic regression
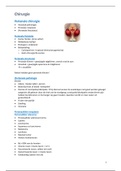
The main difference is
how the linear
predictor is related to
the outcome.
Because the outcome and therefore also the beta-coefficients are presented on different scales, the
interpretation of these are also different. And much less intuitive in the case of logistic regressions than in
the case of OLS regressions.
In a logistic regression the outcome is expressed in terms of “the log of the odds of the outcome”.
QUESTIONS:
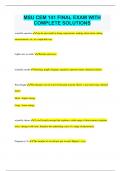
What are the odds?
Odds are calculated as the probability that an outcome
occurs (p) divided by the probability that an outcome
does not occur (q, or: 1-p).
Probabilities are calculated differently but by using the
same information.
Are odds the same as probabilities?
No. They are closely related, but they are NOT the same.
4
WEEK 3
Yes or no? Proportions and probabilities
Inhoud
Knowledge clips................................................................................................................................................2
Knowledge clip 3.1: Logistic regression.....................................................................................................2
Knowledge clip 3.2: OLS vs. Logistic regression.........................................................................................4
Lecture (15 sept)...............................................................................................................................................7
Part 1. OLS and logistic regression................................................................................................................7
Part 2. Logistic regression results..................................................................................................................9
Part 3. Table 2: Fallacy.................................................................................................................................12
Part 4. Roles of theory................................................................................................................................15
Workgroup meeting........................................................................................................................................16
Homework assignment...............................................................................................................................16
Research case 1: Interpreting study results using logistic regression......................................................16
Research case 2: Calculating and interpreting odds ratios......................................................................23
Literature........................................................................................................................................................26
Wheelan: Chapter 8: The central limit theorem.....................................................................................27
Westreich, Greenland (2013). The Table 2 Fallacy: Presenting and interpreting confounder and modifier
coefficients..............................................................................................................................................29
Viera (2008). Odds Ratios and Risk Ratios: What’s the difference and why does it matter?...................31
1
,2023-2024, Block 1 GW4003MV. Advanced Research Methods
Knowledge clips
Knowledge clip 3.1: Logistic regression
The regression type you choose solely depends on the outcome variable of interest. You use a logistic
regression when the outcome variable is dichotomous (only 2 potential values).
Example: RQ: How likely is it that someone gets injured after jumping off a pile of paper?
Outcome = Y = Injured (yes or no)
The difficulty with this RQ: there is no
average probability that someone gets
injured, because that probability
depends on how high the pile of paper
is. Another difficulty: normally we don’t
observe probabilities on the individual
level.
If you record individual observations an infinite
amount of times, the observed proportions will
start taking this S-/sigmoid-shape. In practice this
often isn’t feasable.
If this is not a feasable strategy, how can you still
answer the RQ?: By moving away from
proportions to the estimation of probabilities by
using a regression.
Estimate probability by using a logistic regression:
Sample size = 1000.
QUESTIONS:
What will the plotted data on height (of pile of paper) and injury (yes or no) look like?
The observations are either centered at 0 (no/not injured) or at 1 (yes/injured).
Why is an OLS regression not useful for answering the research question?
When we fit an OLS regression to this data, it is directly clear that this doesn’t capture the observations.
There is a large difference between the fitted
regression curve and the observation points, which
means there is a large error term which isn’t desirable.
Also, this regression curve suggests that it is possible
to have an outcome that falls inbetween 0 and 1 / yes
2
,2023-2024, Block 1 GW4003MV. Advanced Research Methods
or no, or even an outcome that falls lower than 0 or higher than 1 which isn’t possible with probabilities
(they always fall within the 0 – 1 range).
We need a S- or sigmoid-curve that mimics the proportion of volunteers hurting themselves when
jumping of a pile of paper of different heights. That is exactly what a logistic regression does; it models
the probability of the outcome of interest (Y).
Please study this slide . It helps you how an
extended research equation and a DAG are related.
3
, 2023-2024, Block 1 GW4003MV. Advanced Research Methods
Knowledge clip 3.2: OLS vs. Logistic regression
The main difference is
how the linear
predictor is related to
the outcome.
Because the outcome and therefore also the beta-coefficients are presented on different scales, the
interpretation of these are also different. And much less intuitive in the case of logistic regressions than in
the case of OLS regressions.
In a logistic regression the outcome is expressed in terms of “the log of the odds of the outcome”.
QUESTIONS:
What are the odds?
Odds are calculated as the probability that an outcome
occurs (p) divided by the probability that an outcome
does not occur (q, or: 1-p).
Probabilities are calculated differently but by using the
same information.
Are odds the same as probabilities?
No. They are closely related, but they are NOT the same.
4