
Hawkes Learning Lesson 3.4 Frequency Distributions STUDY GUIDE
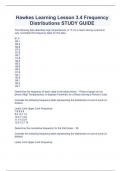
The following data describes high temperatures, in °F, for a resort during a period in July. Complete the frequency table for this data. 91.9 84.1 80.9 83.8 87.0 81.8 83.7 91.8 92.5 85.5 89.8 85.0 81.9 94.1 92.6 84.1 80.5 84.7 Determine the frequency of each class in the table shown. - Photo of graph on my phone (High Temperatures, in degrees Farenheit, for a Resort during a Period in July) Consider the following frequency table representing the distribution of cost of lunch (in dollars). Lower Limit Upper Limit Frequency 7.8 8.9 8 9.0 10.1 12 10.2 11.3 6 11.4 12.5 9 12.6 13.7 14 Determine the cumulative frequency for the third class. - 26 Consider the following frequency table representing the distribution of cost of lunch (in dollars). Lower Limit Upper Limit Frequency
Información del documento
- Subido en
- 4 de septiembre de 2023
- Número de páginas
- 3
- Escrito en
- 2023/2024
- Tipo
- Examen
- Contiene
- Preguntas y respuestas

