Solutions Manual for Financial and Managerial Accounting for MBAs 6th Edition Easton
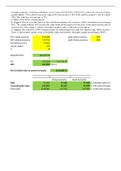
Net nonoperating obligations (NNO) is defined as the excess of (interest-bearing) debt over investments in nonoperating assets. Net nonoperating obligations can be either positive (excess of debt) or negative (excess of investments). Net nonoperating expense (NNE) is the excess of NOPAT over net income. Net nonoperating expense can also be positive (when nonoperating expenses exceed nonoperating income) or negative. Q4-15. The traditional DuPont analysis includes return on assets (ROA), which includes all assets in its denominator. That means that ROA is the average return on all the assets. The RNOA disaggregation method distinguishes between assets that are used for core operations and those that are held as investments and calculates a separate return for each, rather than one average return. The second difference is that the RNOA approach uses “net” assets, which distinguishes the operating liabilities (interest free and self-liquidating) from interest-bearing debt. ©Cambridge Business Publishers, 2021 Financial Accounting for MBAs, 8 th 4-4 Edition Q4-16 The cash conversion cycle measures the average time (in days) to sell inventories, collect the receivables from the customer, repay the suppliers for the inventory purchases, and return to cash. Each time a company completes one cash conversion cycle, it generates profit and cash flow. Managers aim to shorten the cash conversion cycle. Q4-17 A common sized financial statement has each line item expressed in percentage terms. The balance sheet is expressed as a percentage of total assets (the bottom line). This is a useful tool to assess the proportion of each asset and liability to the total company size and to monitor how the proportions change over time. It is also a useful way to compare companies of different sizes because the percentage numbers make the base “common.” A common sized income statement uses total revenue as the common denominator (top line). Each expense percentage shows the proportion of sales that are consumed by the expense. This is an effective way to track changes in costs and to identify reasons for increases or decreases in profitability. A common-sized income statement can be used to compare companies to each other and to benchmark a company to industry standards. ©Cambridge Business Publishers, 2021 Solutions Manual, Module 4 4-5 MINI EXERCISES M4-18. (5 minutes) $ millions Total assets $97,334 $84,524 Less Total liabilities 13,207 10,177 Equity $84,127 $74,347 Return on equity (ROE) = Net income / Average Equity 27.91% M4-19. (10 minutes) a. $ millions Total assets $97,334 $84,524 Less Total liabilities 13,207 10,177 Equity $84,127 $74,347 Return on equity (ROE) = Net income / Average Equity 27.91% Return on assets (ROA) = Net income / Average total assets 24.32% Financial leverage (FL) = Average total assets / Average Equity 1.15 b. $ millions Net income $22,112 Revenue 55,838 Total assets 97,334 84,524 Profit margin (PM) = Net income / Revenue 39.60% Asset turnover (AT) = Revenue / Average total assets 0.61 M4-20. (10 minutes) $ millions February 3, 2019 January 28, 2018 Operating assets $ 42,225 $ 40,934 Operating liabilities 16,679 16,047 Net operating assets (NOA) $ 25,546 $ 24,887 ©Cambridge Business Publishers, 2021 Financial Accounting for MBAs, 8 th 4-6 Edition M4-21. (10 minutes) $ millions February 3, 2019 Nonoperating expense before tax $ 974 Less Tax shield @ 22% 214 Net nonoperating expense (NNE) 760 Net earnings 11,121 NOPAT = Net earnings + NNE 11,881 Net operating profit before tax (NOPBT) 15,530 Tax expense 3,435 Tax on operating profit = Tax expense + Tax shield 3,649 NOPAT = NOPBT – Tax on operating profit 11,881 M4-22. (20 minutes) a. $ millions February 3, 2019 January 28, 2018 Nonoperating expense, before tax $ 974 Less Tax shield @ 22% 214 Net nonoperating expense (NNE) 760 Net earnings 11,121 NOPAT = Net earnings + NNE $11,881 Operating assets 42,225 40,934 Less Operating liabilities 16,679 16,047 Net operating assets (NOA) 25,546 24,887 RNOA = NOPAT / Average NOA 47.12% b. February 3, 2019 NOPM = NOPAT / Net Sales 10.98% NOAT = Net Sales / Average NOA 4.29 ©Cambridge Business Publishers, 2021 Solutions Manual, Module 4 4-7 M4-23. (20 minutes) ($ thousands) a. RNOA = NOPAT / Average net operating assets (NOA) = $1,506,681 / [($11,804,340 + $7,258,593) / 2] = 15.81% b. NOPM = NOPAT / Sales = $1,506,681 / $15,794,341 = 9.54% NOAT= Sales / Average NOA = $15,794,341 / [($11,804,340 + $7,258,593)/2] = 1.66 RNOA= NOPM × NOAT = 9.54% × 1.66 = 15.81% M4-24. (15 minutes) Feb. 01, 2019 Merchandise inventory - net $12,561 Other current assets 938 Property, less accumulated depreciation 18,432 Deferred income taxes - net 294 Goodwill 303 Other assets 995 Operating assets $33,523 Accounts payable $8,279 Accrued compensation and employee benefits 662 Deferred revenue 1,299 Other current liabilities 2,425 Deferred revenue - extended protection plans 827 Other liabilities 1,149 Operating liabilities $14,641 NOA = Operating assets - Operating liabilities $18,882 ©Cambridge Business Publishers, 2021 Financial Accounting for MBAs, 8 th 4-8 Edition M4-25. (15 minutes) ($ millions) NOPAT = Net earnings + NNE = $2,314 + ($624 × (1 – 22%)) = $2,314 + $487 = $2,801 OR: NOPAT = NOPBT – (tax expense + tax shield) = $4,018 – ($1,080 + ($624 x 22%)) = $2,801 M4-26. (20 minutes) Return on equity (ROE) 16.83% Profit margin (PM) 2.96% Financial leverage (FL) 2.63 Computations: Net income $1,683 Equity $10,161 $ 9,842 ROE = Net income / Average equity 16.83% Net income $1,683 Revenue $ 56,912 Profit margin (PM) = Net income / Revenue 2.96% Assets $ 25,413 $27,178 Equity $10,161 $ 9,842 Financial leverage = Average assets / Average equity 2.63 ©Cambridge Business Publishers, 2021 Solutions Manual, Module 4 4-9 M4-27. (15 minutes) Ratio ANF TJX Return on net operating assets (RNOA) 10.47% 73.31% Net operating profit margin (NOPM) 2.43% 7.87% Net operating asset turnover (NOAT) 4.30 9.32 Computations: ANF TJX NOPAT 87.4 3,066.7 Average NOA 834.8 4,183.2 RNOA = NOPAT / Average NOA 10.47% 73.31% NOPAT 87.4 3,066.7 Sales 3,590.1 38,972.9 NOPM = NOPAT / Sales 2.43% 7.87% Sales 3,590.1 38,972.9 Average NOA 834.8 4,183.2 NOAT = Net sales / Average NOA 4.30 9.32 M4-28. (15 minutes) Ratio Current ratio 0.91 0.91 Times interest earned 4.61 5.79 Liabilities-to-Equity 6.99 8.77 Computations: Current assets 34,636 29,913 Current liabilities 37,930 33,037 Current ratio = Current assets / Current liabilities 0.91 0.91 Earnings before interest and tax 22,278 27,425 Interest expense, gross 4,833 4,733 Times interest earned 4.61 5.79 Total liabilities 382,308 391,875 Equity 54,710 44,687 Liabilities-to-Equity ratio 6.99 8.77 ©Cambridge Business Publishers, 2021 Financial Accounting for MBAs, 8 th 4-10 Edition M4-29. (30 minutes) a. Ratio Home Depot Lowe’s Net operating profit (NOPAT) $11,881 $2,801 Return on Net operating assets (RNOA) 47.11% 13.78% Net operating profit margin (NOPM) 10.98% 3.93% Net operating asset turnover (NOAT) 4.29 3.51 Computation: Home Depot Lowe’s Pretax Net Nonoperating Expense 974 624 Tax shield at 22% 214 137 Tax expense 3,435 1,080 Tax on operating profit = Tax expense + Tax shield 3,649 1,217 NOPBT 15,530 4,018 NOPAT = NOPBT - Tax on operating profit 11,881 2,801 NOPAT 11,881 2,801 Average NOA 25,217 20,326 RNOA = NOPAT / Average NOA 47.11% 13.78% NOPAT 11,881 2,801 Sales 108,203 71,309 NOPM = NOPAT / Sales 10.98% 3.93% Sales 108,203 71,309 Average NOA 25,217 20,326 NOAT = Sales / Average NOA 4.29 3.51 b. Home Depot Lowe’s Is more profitable (in $ terms). X Has higher profit margin ( in % terms). X Has more efficient NOA. X Has higher return on NOA. X ©Cambridge Business Publishers, 2021 Solutions Manual, Module 4 4-11 EXERCISES E4-30. (30 minutes) a. Ratio HAL SLB Current ratio 2.32 1.17 Quick ratio 1.51 0.79 Times interest earned 4.45 5.68 Liabilities-to-Equity 1.72 0.93 Computations HAL SLB Current assets $11,151 $15,731 Current liabilities 4,802 13,486 Current ratio = Current assets / Current liabilities 2.32 1.17 Cash and equivalents 2,008 1,433 Short-term investments 0 1,344 Accounts receivable 5,234 7,881 Quick assets 7,242 10,658 Current liabilities 4,802 13,486 Quick ratio = Quick assets / Current liabilities 1.51 0.79 Earnings before interest and tax 2,467 3,050 Interest expense, gross 554 537 Times interest earned = EBIT / Interest expense, gross 4.45 5.68 Total liabilities 16,438 33,921 Equity 9,544 36,586 Liabilities-to-Equity ratio 1.72 0.93 b. HAL SLB Which company appears to be more liquid? X Which company appears to be more solvent? X ©Cambridge Business Publishers, 2021 Financial Accounting for MBAs, 8 th 4-12 Edition E4-31. (30 minutes) a. Ratio HAL SLB DSO = 365 / Accounts receivable turnover 78.1 88.8 DIO = 365 / Inventory turnover 47.1 51.6 DPO = 365 / Accounts payable turnover 48.4 129.8 Cash conversion cycle = DSO + DIO - DPO 76.8 10.6 Computations HAL SLB Total revenue 23,995 32,815 Average accounts receivable 5,135 7,983 Accounts receivable turnover = Total revenue / Average accounts receivable 4.67 4.11 DSO = 365 / Accounts receivable turnover 78.11 88.79 Cost of sales and services 21,009 28,478 Average inventory 2,712 4,028 Inventory turnover = Cost of sales and services / Average inventory 7.75 7.07 DIO = 365 / Inventory turnover 47.12 51.63 Cost of sales and services 21,009 28,478 Average accounts payable

Escuela, estudio y materia
- Institución
- Financial and Managerial Accounting for MBAs
- Grado
- Financial and Managerial Accounting for MBAs
Información del documento
- Subido en
- 7 de agosto de 2023
- Número de páginas
- 540
- Escrito en
- 2023/2024
- Tipo
- Examen
- Contiene
- Preguntas y respuestas
Temas
-
financial and managerial accounting for mbas
-
financial and managerial accounting 6th edition
-
managerial accounting for mbas 6th edition easton