Business Mathematics Man1060- Notes
Week 2
Indices: Rationale behind the use of Indices to Analyse Data
Why use an index?
• It’s a method of simplifying data so that comparisons over time can be made more
easily.
• Comparisons are a form of analysis and can be used to evaluate scale of change. This
information can then be used for decision making.
• Currently looking at discreet data- just one piece of information (data) at each point in
time.
Indices
An index is defined as a series of numbers relating to different times all expressed as a % of a
value at a particular time- this value (at a particular point in time is referred to as the base year
value.
Index number = (Value in any given year/ Value in base year) x 100
Real life Examples:
• Retail Price Index (RPI)- often used as an indicator of inflator.
• Consumer Price Index (CPI)
• FTSE (Financial Times Stock Exchange) 100 (Top one hundred companies in the UK)
Share Index- share prices of UK companies.
• Dow Jones Index- stock (share price of corporation in USA.
• Basic Wage Rates Index- often used by trade unions in wage negotiation.
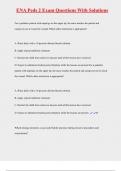
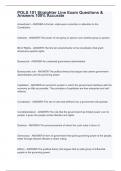
Real World Example- Consumption of Oil for China from 2010 to 2019
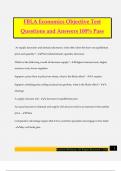
Indices: Changing the Base Year
Selecting and Changing the Base Year
• Although a base year may be satisfactory for several years, it will become less
meaningful as time passes and eventually it will become necessary to shift to a new
base year.
• The new base year needs to be a ‘typical’ year so not too high or too low (think about
correlation and regression) and also fairly recent.
• When rebasing an index all of the historical data should also be rebased. So we need to
forwards and backwards with our calculation
,Indices: Changing the Base Year
Selecting and Changing the Base Year
• Although a base year may be satisfactory for several years, it will become less
meaningful as time passes and eventually it will become necessary to shift to a new
base year.
• The new base year needs to be a ‘typical’ year so not too high or too low (think about
correlation and regression) and also fairly recent.
• When rebasing an index all of the historical data should also be rebased. So we need to
forwards and backwards with our calculations.
,Indices: Weighted Average Indices and their Uses
Weighted Averages
Weighted averages is a method of combining several indices using some kind of weighting the
formula for which would be.
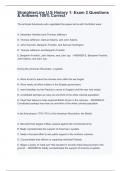
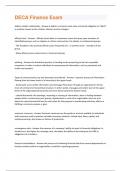
Real World Example: Consumer Price Index (UK)
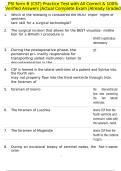
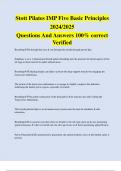
Real World Example: Retail price Index
• Used as a measure of inflation.
• RPI is compiled and published monthly by the ONS (in the UK).
• It is a relative index with current expenditures as weights (Paasche index).
• It is a fixed base index number (base year: January 1987).
• Around 130,000 price quotations are obtained monthly from a representative sample
(geographic, type of retail outlet and size).
, • Around 600 goods and services (‘price indicators’) are then selected to be surveyed.
• The selection of items for inclusions in the index and the weighting given to each item is
determined by a large Government survey called the Family Expenditure Survey (FES).
Steady inflation is an indication that the economy is growing.
Price is rising because consumers are demanding more products. Consumers can only demand
more products if they have more disposable income. Consumers can only have more disposable
income if they have higher/ more salaries and wages. If Salaries and Wages are increasing and
Consumer disposable income is increasing means that consumer demand for products and
services will increase.
If salaries and wages are increasing it suggests cash flow in businesses are also increasing
meaning businesses can increase employee wages. Cash flow only increases in businesses if
there are more sales/ the business is generating more cash.
Week 2
Indices: Rationale behind the use of Indices to Analyse Data
Why use an index?
• It’s a method of simplifying data so that comparisons over time can be made more
easily.
• Comparisons are a form of analysis and can be used to evaluate scale of change. This
information can then be used for decision making.
• Currently looking at discreet data- just one piece of information (data) at each point in
time.
Indices
An index is defined as a series of numbers relating to different times all expressed as a % of a
value at a particular time- this value (at a particular point in time is referred to as the base year
value.
Index number = (Value in any given year/ Value in base year) x 100
Real life Examples:
• Retail Price Index (RPI)- often used as an indicator of inflator.
• Consumer Price Index (CPI)
• FTSE (Financial Times Stock Exchange) 100 (Top one hundred companies in the UK)
Share Index- share prices of UK companies.
• Dow Jones Index- stock (share price of corporation in USA.
• Basic Wage Rates Index- often used by trade unions in wage negotiation.
Real World Example- Consumption of Oil for China from 2010 to 2019
Indices: Changing the Base Year
Selecting and Changing the Base Year
• Although a base year may be satisfactory for several years, it will become less
meaningful as time passes and eventually it will become necessary to shift to a new
base year.
• The new base year needs to be a ‘typical’ year so not too high or too low (think about
correlation and regression) and also fairly recent.
• When rebasing an index all of the historical data should also be rebased. So we need to
forwards and backwards with our calculation
,Indices: Changing the Base Year
Selecting and Changing the Base Year
• Although a base year may be satisfactory for several years, it will become less
meaningful as time passes and eventually it will become necessary to shift to a new
base year.
• The new base year needs to be a ‘typical’ year so not too high or too low (think about
correlation and regression) and also fairly recent.
• When rebasing an index all of the historical data should also be rebased. So we need to
forwards and backwards with our calculations.
,Indices: Weighted Average Indices and their Uses
Weighted Averages
Weighted averages is a method of combining several indices using some kind of weighting the
formula for which would be.
Real World Example: Consumer Price Index (UK)
Real World Example: Retail price Index
• Used as a measure of inflation.
• RPI is compiled and published monthly by the ONS (in the UK).
• It is a relative index with current expenditures as weights (Paasche index).
• It is a fixed base index number (base year: January 1987).
• Around 130,000 price quotations are obtained monthly from a representative sample
(geographic, type of retail outlet and size).
, • Around 600 goods and services (‘price indicators’) are then selected to be surveyed.
• The selection of items for inclusions in the index and the weighting given to each item is
determined by a large Government survey called the Family Expenditure Survey (FES).
Steady inflation is an indication that the economy is growing.
Price is rising because consumers are demanding more products. Consumers can only demand
more products if they have more disposable income. Consumers can only have more disposable
income if they have higher/ more salaries and wages. If Salaries and Wages are increasing and
Consumer disposable income is increasing means that consumer demand for products and
services will increase.
If salaries and wages are increasing it suggests cash flow in businesses are also increasing
meaning businesses can increase employee wages. Cash flow only increases in businesses if
there are more sales/ the business is generating more cash.