cnsl 503 Mod 4 Solved 2023
normal distribution - ANSWER-a frequency distribution that is shaped like a symmetrical
bell, unimodal curve
total relative frequency of distribution - ANSWER-area under curve = 100% of the data
or 1.0
68% of values - ANSWER-% fall within 1 standard deviation of mean
95% of values - ANSWER-% fall within 2 standard deviations of mean
99.7 % of values - ANSWER-fall with in 3 standard deviations of he mean
normal curve defined by - ANSWER-mean and standard deviation
raw score - ANSWER-exact value that is observed
standard score - ANSWER-indicates exactly how many standard deviations a raw score
is above or below the mean. Z-score
What is the purpose of calculating z-scores? - ANSWER-The purpose of calculating z-
scores is to understand a score's relative standing within a distribution. The z-score
standardizes scores from different data sets with different means
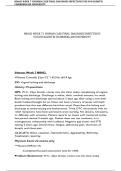
formula for raw score to z-score - ANSWER-
formula for z-score to raw score - ANSWER-
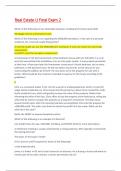
formula for sample mean to z-score - ANSWER-divided by standard error o/square root
of sample
standard normal table - ANSWER-Shows the proportion of values that fall to the left (or
below) of a given z-score in a normal distribution
How to find percentage above z-score - ANSWER-1- p-value
hypothesis testing using a z-score - ANSWER-1) State the null (H0 ) and alternative (Ha
) hypotheses.
2) Determine the critical values.
3) Calculate the z-score.
4) Compare the z-score to the critical value and determine whether to reject H0.
one-tailed test - ANSWER-a directional test because it specifies whether the population
mean increases or decreases after the treatment (can be left or right tail)
normal distribution - ANSWER-a frequency distribution that is shaped like a symmetrical
bell, unimodal curve
total relative frequency of distribution - ANSWER-area under curve = 100% of the data
or 1.0
68% of values - ANSWER-% fall within 1 standard deviation of mean
95% of values - ANSWER-% fall within 2 standard deviations of mean
99.7 % of values - ANSWER-fall with in 3 standard deviations of he mean
normal curve defined by - ANSWER-mean and standard deviation
raw score - ANSWER-exact value that is observed
standard score - ANSWER-indicates exactly how many standard deviations a raw score
is above or below the mean. Z-score
What is the purpose of calculating z-scores? - ANSWER-The purpose of calculating z-
scores is to understand a score's relative standing within a distribution. The z-score
standardizes scores from different data sets with different means
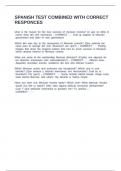
formula for raw score to z-score - ANSWER-
formula for z-score to raw score - ANSWER-
formula for sample mean to z-score - ANSWER-divided by standard error o/square root
of sample
standard normal table - ANSWER-Shows the proportion of values that fall to the left (or
below) of a given z-score in a normal distribution
How to find percentage above z-score - ANSWER-1- p-value
hypothesis testing using a z-score - ANSWER-1) State the null (H0 ) and alternative (Ha
) hypotheses.
2) Determine the critical values.
3) Calculate the z-score.
4) Compare the z-score to the critical value and determine whether to reject H0.
one-tailed test - ANSWER-a directional test because it specifies whether the population
mean increases or decreases after the treatment (can be left or right tail)