Statistics and Mathematics
About SMA
The course provides:
- An introduction to the theory behind basic quantitative data analysis
(morning lectures) alternating with hands on data analysis with SPSS
(afternoon)
Exam: the theoretical MC test. And hands on SPSS test
Course Material:
- Andy Field: discovering statistics using SPSS ed. 4
- For hands- on: Exercise in N@tschool
- Detailed study guide in N@tschool: week to week program.
Topics:
- Variables, measurement levels, distributions
- Probability theory
- The normal distribution, the z-transform
- Hypotheses testing, statistical interference, and statistical models
- Bivariate statistics
o Chi square
o T-tests
o Covariance, correlation
o Simple regression
- Multiple regression
- Regression: moderation and mediation
- One way ANOVA
- Understanding scientific tourism literature (quantitative)
Practical: Study load: 6 ECTS
Theoretical lectures: read the suggested literature at home before each
lecture. And once
more after each lecture. This really helps you understand things better.
Hands-on: do exercises and ask questions during the hands-on, finish everything
at home if
needed. Exercises and homework have to be handed in through N@tschool on
the day before the net lecture at latest.
Hand- ins: Before the next lecture. Required in order to pass.
Inhoud
Lecture 1: 02-02-2017............................................................................................ 3
1
, Variables, distributions and how to describe them............................................................................3
Lecture 2: 09-02-2016............................................................................................ 6
Distributions and how to describe them............................................................................................6
Lecture 3: 16-02-2017.......................................................................................... 12
Normal distributions and interferences............................................................................................12
Lecture 4: 23-02-2017 : Basic probability theory.................................................17
Lecture 5: Introduction to inferential statistics.....................................................24
Lecture 6: Bivariate statistics: T-tests 16/03/2017...............................................31
Lecture 7: Bivariate statistics- Chi- square 23-03-2017........................................41
Lecture 8: Covariance and correlation 30-3-2017................................................46
Lecture 9: Simple Linear Regression....................................................................52
Lecture 10: RECAP 9............................................................................................. 60
Lecture 10: Multiple linear regression..................................................................62
Lecture 11: Moderation regression 4-5-2017........................................................68
Lecture 12: Regression: Mediation, dummy coding 11-05-2017...........................76
Lecture 13: ANOVA (one way).............................................................................. 83
Lecture 14: Course overview and practise session...............................................91
2
,Lecture 1: 02-02-2017
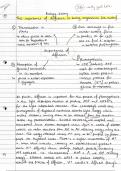
Variables, distributions and how to describe them
Quantitative research is about numbers:
In quantitative research, we capture the world around us in numbers.
Everything that can be expressed in numbers is put together in variables.
Example: let’s characterize the group of 1st- year BTO students with
numbers/
variables. Which variables would we need?
o Age, nationality, home situation, gender, educational background,
hobbies, family situation, pets, hair colour, religion, intelligence
IQ, ?? , life satisfaction.
Operationalisation:
Observable or manifest variables/ factual information = 1 question
- Age, gender, educational level, number of employees, holiday destination.
Non-observable variable or latent variables are operationalised through a
number of questions which together form a scale:
- Attitudes, beliefs, characteristics (intelligence, happiness), satisfaction.
Operationalisation of latent variables:
Satisfaction with life (something like happiness)
- Measured with 5 indicators/ questions answered on a 5- point Likert
scale
1. In most ways my life is close to my ideal
2. The conditions of life are excellent
3. I am satisfied with my life
4. So far I have got the important things I want in life
5. If I could live my life over, I would change almost nothing
Latent variable: superstition (bijgelovigheid)
- What is superstition? 1. Do certain things or 2. Believing
Measurement scale: items that have to measure the construct
1. I usually avoid walking under ladders
2. Black cats are trouble
3. I always feel nervous on Friday 13th
4. I have lucky clothes
5. Sometimes I cross myself before doing something important
Response scale: 5 point Likert scale. 1. strongly disagree, 2. disagree, 3.
Neutral, 4. Agree, 5. Strongly agree.
Likert items and Likert-scales
Together these 5 items constitute a Likert scale
Adding up the scores of the answers You divide by 5 because of 5 questions
overall score of superstition
Likert scales: Reliability and validity issues:
- Reliable if one and the same respondent answers approximately similarly
on the different questions within the scale.
3
, Reliability: if you repeat the measurement a multiple times, the answer should
be the same.
Scale to be reliable:
- Reversed phrased questions
- The same measurement unit for every question
Validity: Is the thing that I measure really the thing I want to measure?
- It is not measuring what it is intended to measure.
- It comes in different aspects:
o Content validity:
Do the different questions cover all of the contents of the
construct to be measured?
o Construct validity:
Does the measurement scale reflect the (a) theoretical
position regarding the construct. E.g. superstition as a one-
dimensional construct, or a 2-dimensional construct.
Can you defend the measurement scale based on the
theoretical aspect?
Variables and measurement levels
Age Gender
A lot of dimensions 3 dimensions
Continuous number 3 categories
Continuous variable/ real numbers categorical variable
Gender Educational background
Categorical variable Categorical variable
Order does not matter Order does matter
Categorical variable:
- Order does matter
Order does not matter
Measurement levels:
- Nominal scale:
o for categorical data.
o Order is irrelevant.
o Assignment of a number to a category entirely arbitrary.-
o basically a ‘name’, hence the term nominal.
- Ordinal scale:
o for categorical data.
o Numbers to categories.
o Arbitrary assignment.
o BUT there is logical ordering of the categories
- Interval scale:
o For continuous data
o The intervals between the different scores are of equal distance,
hence the term interval. (e.g. year of birth. Some of order and there
is an equal distance)
o Ordered and equal sized intervals
- Ratio scale:
4
About SMA
The course provides:
- An introduction to the theory behind basic quantitative data analysis
(morning lectures) alternating with hands on data analysis with SPSS
(afternoon)
Exam: the theoretical MC test. And hands on SPSS test
Course Material:
- Andy Field: discovering statistics using SPSS ed. 4
- For hands- on: Exercise in N@tschool
- Detailed study guide in N@tschool: week to week program.
Topics:
- Variables, measurement levels, distributions
- Probability theory
- The normal distribution, the z-transform
- Hypotheses testing, statistical interference, and statistical models
- Bivariate statistics
o Chi square
o T-tests
o Covariance, correlation
o Simple regression
- Multiple regression
- Regression: moderation and mediation
- One way ANOVA
- Understanding scientific tourism literature (quantitative)
Practical: Study load: 6 ECTS
Theoretical lectures: read the suggested literature at home before each
lecture. And once
more after each lecture. This really helps you understand things better.
Hands-on: do exercises and ask questions during the hands-on, finish everything
at home if
needed. Exercises and homework have to be handed in through N@tschool on
the day before the net lecture at latest.
Hand- ins: Before the next lecture. Required in order to pass.
Inhoud
Lecture 1: 02-02-2017............................................................................................ 3
1
, Variables, distributions and how to describe them............................................................................3
Lecture 2: 09-02-2016............................................................................................ 6
Distributions and how to describe them............................................................................................6
Lecture 3: 16-02-2017.......................................................................................... 12
Normal distributions and interferences............................................................................................12
Lecture 4: 23-02-2017 : Basic probability theory.................................................17
Lecture 5: Introduction to inferential statistics.....................................................24
Lecture 6: Bivariate statistics: T-tests 16/03/2017...............................................31
Lecture 7: Bivariate statistics- Chi- square 23-03-2017........................................41
Lecture 8: Covariance and correlation 30-3-2017................................................46
Lecture 9: Simple Linear Regression....................................................................52
Lecture 10: RECAP 9............................................................................................. 60
Lecture 10: Multiple linear regression..................................................................62
Lecture 11: Moderation regression 4-5-2017........................................................68
Lecture 12: Regression: Mediation, dummy coding 11-05-2017...........................76
Lecture 13: ANOVA (one way).............................................................................. 83
Lecture 14: Course overview and practise session...............................................91
2
,Lecture 1: 02-02-2017
Variables, distributions and how to describe them
Quantitative research is about numbers:
In quantitative research, we capture the world around us in numbers.
Everything that can be expressed in numbers is put together in variables.
Example: let’s characterize the group of 1st- year BTO students with
numbers/
variables. Which variables would we need?
o Age, nationality, home situation, gender, educational background,
hobbies, family situation, pets, hair colour, religion, intelligence
IQ, ?? , life satisfaction.
Operationalisation:
Observable or manifest variables/ factual information = 1 question
- Age, gender, educational level, number of employees, holiday destination.
Non-observable variable or latent variables are operationalised through a
number of questions which together form a scale:
- Attitudes, beliefs, characteristics (intelligence, happiness), satisfaction.
Operationalisation of latent variables:
Satisfaction with life (something like happiness)
- Measured with 5 indicators/ questions answered on a 5- point Likert
scale
1. In most ways my life is close to my ideal
2. The conditions of life are excellent
3. I am satisfied with my life
4. So far I have got the important things I want in life
5. If I could live my life over, I would change almost nothing
Latent variable: superstition (bijgelovigheid)
- What is superstition? 1. Do certain things or 2. Believing
Measurement scale: items that have to measure the construct
1. I usually avoid walking under ladders
2. Black cats are trouble
3. I always feel nervous on Friday 13th
4. I have lucky clothes
5. Sometimes I cross myself before doing something important
Response scale: 5 point Likert scale. 1. strongly disagree, 2. disagree, 3.
Neutral, 4. Agree, 5. Strongly agree.
Likert items and Likert-scales
Together these 5 items constitute a Likert scale
Adding up the scores of the answers You divide by 5 because of 5 questions
overall score of superstition
Likert scales: Reliability and validity issues:
- Reliable if one and the same respondent answers approximately similarly
on the different questions within the scale.
3
, Reliability: if you repeat the measurement a multiple times, the answer should
be the same.
Scale to be reliable:
- Reversed phrased questions
- The same measurement unit for every question
Validity: Is the thing that I measure really the thing I want to measure?
- It is not measuring what it is intended to measure.
- It comes in different aspects:
o Content validity:
Do the different questions cover all of the contents of the
construct to be measured?
o Construct validity:
Does the measurement scale reflect the (a) theoretical
position regarding the construct. E.g. superstition as a one-
dimensional construct, or a 2-dimensional construct.
Can you defend the measurement scale based on the
theoretical aspect?
Variables and measurement levels
Age Gender
A lot of dimensions 3 dimensions
Continuous number 3 categories
Continuous variable/ real numbers categorical variable
Gender Educational background
Categorical variable Categorical variable
Order does not matter Order does matter
Categorical variable:
- Order does matter
Order does not matter
Measurement levels:
- Nominal scale:
o for categorical data.
o Order is irrelevant.
o Assignment of a number to a category entirely arbitrary.-
o basically a ‘name’, hence the term nominal.
- Ordinal scale:
o for categorical data.
o Numbers to categories.
o Arbitrary assignment.
o BUT there is logical ordering of the categories
- Interval scale:
o For continuous data
o The intervals between the different scores are of equal distance,
hence the term interval. (e.g. year of birth. Some of order and there
is an equal distance)
o Ordered and equal sized intervals
- Ratio scale:
4