Report 2
Introduction
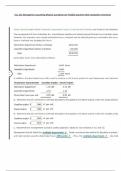
In this report I have been given Car Insurance Information which seems to show the pricing
of the Policies and extra costs that comes with the policy, from what I can make out it all
seems to about 1 year unlike the other spreadsheet. The data is all organised in 1 sheet with
different categories which make things simpler for me to organise. First I well have to make
sure the data is correct in different level such as if it’s accurate and how up to date it is. Then
once I have verified everything I will then make 3 different graphs from the information and
make recommendations the manager can use hopefully.
Data
With all the data I collected from the spreadsheet I had to make sure a couple of things
which was the information’s validity, accuracy, relevance and currency. Not knowing these
things could result into me getting the wrong information and redundant data.
Validity – First I had to verify the information for its validity and making sure it was the correct
for my purpose. I already knew the source where the data has come from which is FSA Car
Insurance Information, so I went on their website to check what kind of information they
provide. To further verify the information was correct I checked 3 of the car insurance
companies websites to make sure the pricing is correct or at least similar.
Accuracy – The information seems to be accurate as there is no odd patterns or spikes in
the data, for example none of the data seems to jump in pricing and it’s all normally in the
range of £50, £250 so this way I know the information is accurate,
Relevance – All the data in spreadsheet was relevant to what I needed for because I was
asked to analyse data for the business linked with Motor vehicles and the spreadsheet
shown different car insurance policies prices with excess compulsory and voluntary.
Currency- The information has not been updated because it is from the past, the data shows
information from 2013 and 2012 which I can still analyse and get important facts but it is not
the latest information to something like this current year 2015. Also even though it has 4
months’ worth of information it doesn’t show every month which means it was not regularly
updated.
Investigation
From the spreadsheet I will then investigate this data and sort it in ascending order so I can
find the top and lowest selling like I found in the other spreadsheets. From the graphs I will
take about the
Introduction
In this report I have been given Car Insurance Information which seems to show the pricing
of the Policies and extra costs that comes with the policy, from what I can make out it all
seems to about 1 year unlike the other spreadsheet. The data is all organised in 1 sheet with
different categories which make things simpler for me to organise. First I well have to make
sure the data is correct in different level such as if it’s accurate and how up to date it is. Then
once I have verified everything I will then make 3 different graphs from the information and
make recommendations the manager can use hopefully.
Data
With all the data I collected from the spreadsheet I had to make sure a couple of things
which was the information’s validity, accuracy, relevance and currency. Not knowing these
things could result into me getting the wrong information and redundant data.
Validity – First I had to verify the information for its validity and making sure it was the correct
for my purpose. I already knew the source where the data has come from which is FSA Car
Insurance Information, so I went on their website to check what kind of information they
provide. To further verify the information was correct I checked 3 of the car insurance
companies websites to make sure the pricing is correct or at least similar.
Accuracy – The information seems to be accurate as there is no odd patterns or spikes in
the data, for example none of the data seems to jump in pricing and it’s all normally in the
range of £50, £250 so this way I know the information is accurate,
Relevance – All the data in spreadsheet was relevant to what I needed for because I was
asked to analyse data for the business linked with Motor vehicles and the spreadsheet
shown different car insurance policies prices with excess compulsory and voluntary.
Currency- The information has not been updated because it is from the past, the data shows
information from 2013 and 2012 which I can still analyse and get important facts but it is not
the latest information to something like this current year 2015. Also even though it has 4
months’ worth of information it doesn’t show every month which means it was not regularly
updated.
Investigation
From the spreadsheet I will then investigate this data and sort it in ascending order so I can
find the top and lowest selling like I found in the other spreadsheets. From the graphs I will
take about the