Samenvatting Quantitative
methode
Werkcolleges
Theme 1: Intro, Variables and Techniques, OLS
1. Linear regression analysis
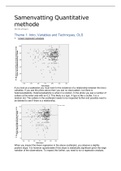
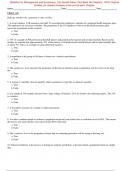
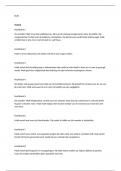
If you look at a scatterplot you must look for the existence of a relationship between the (two)
variables. If you see the photo above then you see no clear pattern, but there is
heteroscedasticity. Heteroscedasticity is when it is random. In the photo you see a number of
outliers at the lower side with an 0,3. This likely is a typo. A typo is like a outlier, it is a
random dot. The outliers in the scatterplot needs to be inspected further and possibly need to
be deleted to see if there is a relationship.
When you inspect the linear regression in the above scatterplot, you observe a slightly
positive slope. It is however questionable if this slope is statistically significant given the large
variation of the observations. To inspect this further, you need to run a regression analysis.
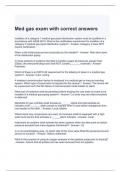
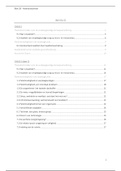
, The first table ‘Variables Entered/Removed’ gives information about the explanatory
variables and the method that SPSS used to derive the model. There are different ways to
add variables in your regression model. I do not explain these different ways here, but under
the method is states “Enter”. This simply means that all explanatory variables were added to
the model simultaneously (of course with just one explanatory variable, there are no other
options). In the column ‘Variables Entered’ you see the variables that are included in the
model.
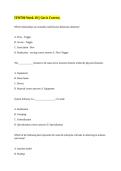
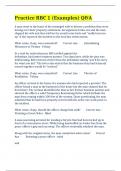
The second table in the SPSS regression output has the title ‘Model Summary’. As this title
suggests, this table provides a summary of the model, including the important measures “R-
Square” and the “Adjusted R-Square”. The R-Square or “Goodness-of-fit” of the model
indicates how well the model fits the data. To be precise, it corresponds to the share of the
variation of the dependent variable that is explained by the model. The R-Square is always
between zero and one: it is zero if the model explains it entirely. So, in principle you can say
the larger R-Square the better the model.
Next to the R-Square you also find the measure ‘Adjusted R-Square’ in the table. This also
indicated how well the model fits the data, but it uses a slightly different formula, which also
takes into account the number of explanatory variables included in the model. It includes a
sort of punishment (reduction) for adding extra variables to the model and therefore the
Adjusted R-Square is always smaller than the R-Square measure of a model.
The R-Square and Adjusted R-Square of the model show that the bivariate linear regression
model hardly explains any variation of the dependent variable, so the model is rather
useless. R-Square indicates that the model only explains 0,4% of the variation of the
dependent variable (valuation for the region).
methode
Werkcolleges
Theme 1: Intro, Variables and Techniques, OLS
1. Linear regression analysis
If you look at a scatterplot you must look for the existence of a relationship between the (two)
variables. If you see the photo above then you see no clear pattern, but there is
heteroscedasticity. Heteroscedasticity is when it is random. In the photo you see a number of
outliers at the lower side with an 0,3. This likely is a typo. A typo is like a outlier, it is a
random dot. The outliers in the scatterplot needs to be inspected further and possibly need to
be deleted to see if there is a relationship.
When you inspect the linear regression in the above scatterplot, you observe a slightly
positive slope. It is however questionable if this slope is statistically significant given the large
variation of the observations. To inspect this further, you need to run a regression analysis.
, The first table ‘Variables Entered/Removed’ gives information about the explanatory
variables and the method that SPSS used to derive the model. There are different ways to
add variables in your regression model. I do not explain these different ways here, but under
the method is states “Enter”. This simply means that all explanatory variables were added to
the model simultaneously (of course with just one explanatory variable, there are no other
options). In the column ‘Variables Entered’ you see the variables that are included in the
model.
The second table in the SPSS regression output has the title ‘Model Summary’. As this title
suggests, this table provides a summary of the model, including the important measures “R-
Square” and the “Adjusted R-Square”. The R-Square or “Goodness-of-fit” of the model
indicates how well the model fits the data. To be precise, it corresponds to the share of the
variation of the dependent variable that is explained by the model. The R-Square is always
between zero and one: it is zero if the model explains it entirely. So, in principle you can say
the larger R-Square the better the model.
Next to the R-Square you also find the measure ‘Adjusted R-Square’ in the table. This also
indicated how well the model fits the data, but it uses a slightly different formula, which also
takes into account the number of explanatory variables included in the model. It includes a
sort of punishment (reduction) for adding extra variables to the model and therefore the
Adjusted R-Square is always smaller than the R-Square measure of a model.
The R-Square and Adjusted R-Square of the model show that the bivariate linear regression
model hardly explains any variation of the dependent variable, so the model is rather
useless. R-Square indicates that the model only explains 0,4% of the variation of the
dependent variable (valuation for the region).