Samenvatting Introductie Statistische Methoden voor Data-analyse
GZW1026
Inhoudsopgave
Seminar 1.1 ...................................................................................................................................................... 2
Seminar 1.2 .................................................................................................................................................... 11
Seminar 2.1 .................................................................................................................................................... 23
Seminar 2.2 .................................................................................................................................................... 32
Seminar 3.1 .................................................................................................................................................... 39
Seminar 3.2 .................................................................................................................................................... 46
Seminar 4.1 .................................................................................................................................................... 54
Seminar 4.2 .................................................................................................................................................... 60
,Seminar 1.1
Question 1 What is the level of measurement for the number of pets in a family?
a. Nominal
b. Ordinal
c. Interval
d. Ratio
The number of pets in a household is at ratio measurement level. It can be categorized and
ranked and there are equal intervals between consecutive numbers. There is also an absolute
zero point because at zero number of pets, the variable is completely absent.
Question 2 In which situation is the median a better summary statistic than the mean?
a. When the data are of nominal scale level
b. When the data are of ordinal scale level
c. When the data are of interval scale level
d. When the data are of ratio scale level
The median is the value that is exactly in the middle of a dataset when you put the values
from low to high. It is a center measure that separates the lowest 50% of values from the
highest 50%. The median is usually used for quantitative data, but can also be used for ordinal
data.
Question 3 What type of graph is appropriate when summarizing blood types in patients with
prostate cancer?
a. Bar chart
b. Box plot
c. Histogram
d. Scatter plot
A bar chart is the graphical representation of the frequency distribution of data derived from a
discrete probability distribution. This diagram shows bars of small width with height equal to
the frequencies established above the possible values. A bar chart provides a picture of the
probability function from which the data originated.
Question 4 Which of the following is NOT true for a normal distribution?
a. Median is equal to the mode
b. Mode is equal to the mean
c. The distribution is skewed to the right
d. Approximately 95% of the observations are located between the mean minus two
times the standard deviation and the means plus two times the standard deviation
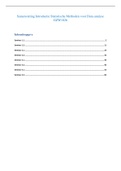
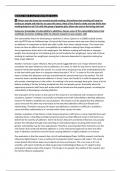
In a normal distribution, the median, mode and mean are equal to each other. As shown in the
picture below, about 95% of the observations lies between the mean minus two times the
standard deviation and the mean plus two times the standard deviation.
,Question 5 Which of the following is true for a distribution skewed to the left?
a. The mean is smaller than the median, the median is smaller than the mode
b. The mode is smaller than the median, the median is smaller than the mean
c. The median is smaller than the mean, the mean is smaller than the mode
d. The mode, median and mean are equal
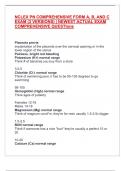
In a perfectly symmetric distribution, the mean, mode, and median are equal.
A distribution skewed to the left is so called because the distribution is pulled to the left. In
this, the mean is smaller than the median, and both of these are smaller than the mode.
Question 6 Which of the following is true of a normal distribution?
a. The distribution has two modes
b. The distribution is not symmetric
c. Approximately 68% of the observations are located between the mean minus one
standard deviation and the mean plus one standard deviation
d. Approximately 50% of the observations are located between the mean minus one
standard deviation and the mean plus one standard deviation
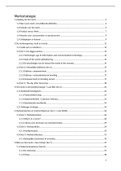
Most of the data (68.2%) is plus and minus one standard deviation from the mean. A normal
distribution has only one mode and a symmetric distribution.
Question 7 What does a very low variance indicate?
a. The data set is too small
b. The individuals in the data set are very different from each other
c. The individuals in the data set are very similar to each other
d. The individuals in the data set form 2 distinct groups
, With small variance, there is a small distribution of numbers around the mean. This means
that the data are the same or very close to each other.
Question 8 Explain the level of measurement for the following variables:
a. Favorite color for a car – Nominal
b. Social economic status (low, middle, high) – Ordinal
c. Income (in euros) – Ratio
d. Temperature (in degrees Celsius) – Interval
e. Number of classes a student misses in a course – Ratio
f. Whether or not a person believes in love at first sight – Nominal
A: You can categorize the favorite color for a car by assigning labels. Each data point can
only belong to one label and there is no ranking.
B: You can categorize and rank socioeconomic status, but you can't say anything about the
intervals between categories.
C: You can categorize and rank income in euros, and there are equal intervals between
successive data points. There is also an absolute zero point.
D: You can categorize and rank the temperature in degrees, and there are equal intervals
between categories. There is no absolute zero point.
E: You can categorize and rank the number of lessons a student misses in a block, and there
are equal intervals between successive data points. There is also an absolute zero point.
F: You can categorize whether or not you believe in love at first sight by assigning labels.
Each data point can only belong to one label and there is no ranking.
Question 9 Calculate the mean and median of weight for these students.
The following measurements are the weight of n = 10 students that are randomly selected
from a study of anthropometry at Maastricht University.
49, 66, 67, 57, 72.5, 63, 64, 86, 62, 61
The mean of these 10 students is 64,8
49 57 61 62 63 64 66 67 72,5 86
The median of these 10 students is (63+64)/2= 63,5
Question 10 Recalculate the mean and median for the new sample.
After reviewing the data, it turned out that the maximum of weight from the above sample
(max weight = 86) was incorrectly administered. The true value is 129.
49, 66, 67, 57, 72.5, 63, 64, 129, 62, 61
The mean of these 10 students 69,1
49 57 61 62 63 64 66 67 72,5 129
The median of these 10 students is (63+64)/2= 63,5
Question 11 What would you conclude when comparing the results of Question 9 and
Question 10?
The median remains the same and is reserved for outliers like 129. The mean, on the other
hand, gets a lot higher because of this outlier of 129.
Question 12 Find the the standard deviation of cholesterol for this list. What does the
standard deviation mean?
GZW1026
Inhoudsopgave
Seminar 1.1 ...................................................................................................................................................... 2
Seminar 1.2 .................................................................................................................................................... 11
Seminar 2.1 .................................................................................................................................................... 23
Seminar 2.2 .................................................................................................................................................... 32
Seminar 3.1 .................................................................................................................................................... 39
Seminar 3.2 .................................................................................................................................................... 46
Seminar 4.1 .................................................................................................................................................... 54
Seminar 4.2 .................................................................................................................................................... 60
,Seminar 1.1
Question 1 What is the level of measurement for the number of pets in a family?
a. Nominal
b. Ordinal
c. Interval
d. Ratio
The number of pets in a household is at ratio measurement level. It can be categorized and
ranked and there are equal intervals between consecutive numbers. There is also an absolute
zero point because at zero number of pets, the variable is completely absent.
Question 2 In which situation is the median a better summary statistic than the mean?
a. When the data are of nominal scale level
b. When the data are of ordinal scale level
c. When the data are of interval scale level
d. When the data are of ratio scale level
The median is the value that is exactly in the middle of a dataset when you put the values
from low to high. It is a center measure that separates the lowest 50% of values from the
highest 50%. The median is usually used for quantitative data, but can also be used for ordinal
data.
Question 3 What type of graph is appropriate when summarizing blood types in patients with
prostate cancer?
a. Bar chart
b. Box plot
c. Histogram
d. Scatter plot
A bar chart is the graphical representation of the frequency distribution of data derived from a
discrete probability distribution. This diagram shows bars of small width with height equal to
the frequencies established above the possible values. A bar chart provides a picture of the
probability function from which the data originated.
Question 4 Which of the following is NOT true for a normal distribution?
a. Median is equal to the mode
b. Mode is equal to the mean
c. The distribution is skewed to the right
d. Approximately 95% of the observations are located between the mean minus two
times the standard deviation and the means plus two times the standard deviation
In a normal distribution, the median, mode and mean are equal to each other. As shown in the
picture below, about 95% of the observations lies between the mean minus two times the
standard deviation and the mean plus two times the standard deviation.
,Question 5 Which of the following is true for a distribution skewed to the left?
a. The mean is smaller than the median, the median is smaller than the mode
b. The mode is smaller than the median, the median is smaller than the mean
c. The median is smaller than the mean, the mean is smaller than the mode
d. The mode, median and mean are equal
In a perfectly symmetric distribution, the mean, mode, and median are equal.
A distribution skewed to the left is so called because the distribution is pulled to the left. In
this, the mean is smaller than the median, and both of these are smaller than the mode.
Question 6 Which of the following is true of a normal distribution?
a. The distribution has two modes
b. The distribution is not symmetric
c. Approximately 68% of the observations are located between the mean minus one
standard deviation and the mean plus one standard deviation
d. Approximately 50% of the observations are located between the mean minus one
standard deviation and the mean plus one standard deviation
Most of the data (68.2%) is plus and minus one standard deviation from the mean. A normal
distribution has only one mode and a symmetric distribution.
Question 7 What does a very low variance indicate?
a. The data set is too small
b. The individuals in the data set are very different from each other
c. The individuals in the data set are very similar to each other
d. The individuals in the data set form 2 distinct groups
, With small variance, there is a small distribution of numbers around the mean. This means
that the data are the same or very close to each other.
Question 8 Explain the level of measurement for the following variables:
a. Favorite color for a car – Nominal
b. Social economic status (low, middle, high) – Ordinal
c. Income (in euros) – Ratio
d. Temperature (in degrees Celsius) – Interval
e. Number of classes a student misses in a course – Ratio
f. Whether or not a person believes in love at first sight – Nominal
A: You can categorize the favorite color for a car by assigning labels. Each data point can
only belong to one label and there is no ranking.
B: You can categorize and rank socioeconomic status, but you can't say anything about the
intervals between categories.
C: You can categorize and rank income in euros, and there are equal intervals between
successive data points. There is also an absolute zero point.
D: You can categorize and rank the temperature in degrees, and there are equal intervals
between categories. There is no absolute zero point.
E: You can categorize and rank the number of lessons a student misses in a block, and there
are equal intervals between successive data points. There is also an absolute zero point.
F: You can categorize whether or not you believe in love at first sight by assigning labels.
Each data point can only belong to one label and there is no ranking.
Question 9 Calculate the mean and median of weight for these students.
The following measurements are the weight of n = 10 students that are randomly selected
from a study of anthropometry at Maastricht University.
49, 66, 67, 57, 72.5, 63, 64, 86, 62, 61
The mean of these 10 students is 64,8
49 57 61 62 63 64 66 67 72,5 86
The median of these 10 students is (63+64)/2= 63,5
Question 10 Recalculate the mean and median for the new sample.
After reviewing the data, it turned out that the maximum of weight from the above sample
(max weight = 86) was incorrectly administered. The true value is 129.
49, 66, 67, 57, 72.5, 63, 64, 129, 62, 61
The mean of these 10 students 69,1
49 57 61 62 63 64 66 67 72,5 129
The median of these 10 students is (63+64)/2= 63,5
Question 11 What would you conclude when comparing the results of Question 9 and
Question 10?
The median remains the same and is reserved for outliers like 129. The mean, on the other
hand, gets a lot higher because of this outlier of 129.
Question 12 Find the the standard deviation of cholesterol for this list. What does the
standard deviation mean?