Lecture notes Statistics
Lecture 1: Introduction
Statistical toolbox - Some very important “tools”:
▪ Mean
▪ Dispersion
▪ Variance
▪ Standard deviation
Are differences in averages (means) random variations by chance or are they statistically different
from each other? Statistically significant differences?
Distance/deviation from the observation to the mean (dispersion):
Adding up all the deviations of all the different individual observations from the mean, will lead to a
sum of zero.
1
, - Mean/average of deviations → will lead to zero and
therefore is not useful (since the sum of deviations
is zero)
- Mean/average of abs. deviations
- Mean/average of squared deviations (= variance)→
most meaningful when data of the entire
population is used (which most often is not
available)(variance of the population), but requires
adjustment in case of a sample of data of a certain
population is being used (variance of a sample),
which is always the case:
𝑠𝑢𝑚 𝑜𝑓 𝑠𝑞𝑢𝑎𝑟𝑒𝑠 (𝑆𝑆) 𝑆𝑆
Variance: 𝑑𝑒𝑔𝑟𝑒𝑒𝑠 𝑜𝑓 𝑓𝑟𝑒𝑒𝑑𝑜𝑚 = 𝑛 (𝑛𝑢𝑚𝑏𝑒𝑟 𝑜𝑓 𝑜𝑏𝑠𝑒𝑟𝑣𝑎𝑡𝑖𝑜𝑛𝑠)−1
• Variance is a measure for the dispersion of the data
• The average of the squared deviations from the mean
• Squaring makes each term positive so that values above the mean do not cancel values
below the mean
• Give you a very general idea of the spread of your data.
• A value of zero means that there is no variability
The degrees of freedom is n -1 since the sum of the deviations is always zero, this means that in case
of 5 deviations, 4 of the 5 deviations can be any free number, however the 5th deviation is a fixed
number because it needs to add up to zero (in order for the total sum to be zero).
2
,To say something about the dispersion of the data on the original scale, the standard deviation is
used
Standard deviation = square root of variance
Variation (= sum of squares)
A (generalized) representative sample is not a perfect reflection of the total population, it is always a
bit different. A sample always involves (unbiased) mistakes, too precise and realistic number →
degrees of freedom is used. Different ways of degrees of freedom are used for different formulas,
however the same idea behind it implies to all formulas.
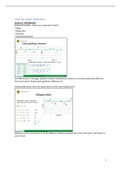
Pattern of normal distribution:
+/- 1.96 = mean +/- 2s
Standard deviations are mean ± 1s (68% of observations) and mean ± 2s (95% of observations)
3
, Lecture 2: Descriptive statistics
1. Statistics: Why and when?
• Techniques for processing (large amounts of) data in different situations, e.g.
• Climate data (climate research) (KNMI)
• Experimental data (treatment-control groups)
• Survey data
• Etc.
• Less commonly used in qualitative research
• Open interviews result in data that is less structured, and less quantitative. Statistics in
qualitative research involves lots of coding, therefore a lot of information is lost.
Statistical Toolkit - Lots of tools!
• Different ways to measure
• Different types of data
• Different types of questions
• Number of groups (1 or more)
• Number of explanatory (independent) variables
• etc.
per situation:
• What tool is most appropriate?
• How to use this tool?
• How to interpret the results?
• How to draw your conclusions
Dependent (DV) and independent variable (IV): the researcher can modify the independent variable,
which influences and changes the dependent variable accordingly.
IV→DV
IV…
IV…
2. Descriptive vs inductive statistics
- Inductive (/inferential) statistics: generalizing tot the population, is it really effective?
4
Lecture 1: Introduction
Statistical toolbox - Some very important “tools”:
▪ Mean
▪ Dispersion
▪ Variance
▪ Standard deviation
Are differences in averages (means) random variations by chance or are they statistically different
from each other? Statistically significant differences?
Distance/deviation from the observation to the mean (dispersion):
Adding up all the deviations of all the different individual observations from the mean, will lead to a
sum of zero.
1
, - Mean/average of deviations → will lead to zero and
therefore is not useful (since the sum of deviations
is zero)
- Mean/average of abs. deviations
- Mean/average of squared deviations (= variance)→
most meaningful when data of the entire
population is used (which most often is not
available)(variance of the population), but requires
adjustment in case of a sample of data of a certain
population is being used (variance of a sample),
which is always the case:
𝑠𝑢𝑚 𝑜𝑓 𝑠𝑞𝑢𝑎𝑟𝑒𝑠 (𝑆𝑆) 𝑆𝑆
Variance: 𝑑𝑒𝑔𝑟𝑒𝑒𝑠 𝑜𝑓 𝑓𝑟𝑒𝑒𝑑𝑜𝑚 = 𝑛 (𝑛𝑢𝑚𝑏𝑒𝑟 𝑜𝑓 𝑜𝑏𝑠𝑒𝑟𝑣𝑎𝑡𝑖𝑜𝑛𝑠)−1
• Variance is a measure for the dispersion of the data
• The average of the squared deviations from the mean
• Squaring makes each term positive so that values above the mean do not cancel values
below the mean
• Give you a very general idea of the spread of your data.
• A value of zero means that there is no variability
The degrees of freedom is n -1 since the sum of the deviations is always zero, this means that in case
of 5 deviations, 4 of the 5 deviations can be any free number, however the 5th deviation is a fixed
number because it needs to add up to zero (in order for the total sum to be zero).
2
,To say something about the dispersion of the data on the original scale, the standard deviation is
used
Standard deviation = square root of variance
Variation (= sum of squares)
A (generalized) representative sample is not a perfect reflection of the total population, it is always a
bit different. A sample always involves (unbiased) mistakes, too precise and realistic number →
degrees of freedom is used. Different ways of degrees of freedom are used for different formulas,
however the same idea behind it implies to all formulas.
Pattern of normal distribution:
+/- 1.96 = mean +/- 2s
Standard deviations are mean ± 1s (68% of observations) and mean ± 2s (95% of observations)
3
, Lecture 2: Descriptive statistics
1. Statistics: Why and when?
• Techniques for processing (large amounts of) data in different situations, e.g.
• Climate data (climate research) (KNMI)
• Experimental data (treatment-control groups)
• Survey data
• Etc.
• Less commonly used in qualitative research
• Open interviews result in data that is less structured, and less quantitative. Statistics in
qualitative research involves lots of coding, therefore a lot of information is lost.
Statistical Toolkit - Lots of tools!
• Different ways to measure
• Different types of data
• Different types of questions
• Number of groups (1 or more)
• Number of explanatory (independent) variables
• etc.
per situation:
• What tool is most appropriate?
• How to use this tool?
• How to interpret the results?
• How to draw your conclusions
Dependent (DV) and independent variable (IV): the researcher can modify the independent variable,
which influences and changes the dependent variable accordingly.
IV→DV
IV…
IV…
2. Descriptive vs inductive statistics
- Inductive (/inferential) statistics: generalizing tot the population, is it really effective?
4