Topic/Skill Definition/Tips
Topic: Real Life Graphs Example
1. Real Life Graphs that are supposed to model some
Graphs real-life situation.
The actual meaning of the values depends
on the labels and units on each axis.
The gradient might have a contextual
meaning.
The y-intercept might have a contextual
meaning.
The area under the graph might have a
contextual meaning.
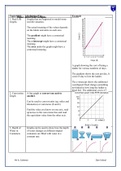
A graph showing the cost of hiring a
ladder for various numbers of days.
The gradient shows the cost per day. It
costs £3/day to hire the ladder.
The y-intercept shows the additional
cost/deposit/fixed charge (something
not linked to how long the ladder is
hired for). The additional cost is £7.
2. Conversion A line graph to convert one unit to
Graph another.
Can be used to convert units (eg. miles and
kilometres) or currencies ($ and £)
Find the value you know on one axis, read
up/across to the conversion line and read
the equivalent value from the other axis.
8 km=5 miles
3. Depth of Graphs can be used to show how the depth
Water in of water changes as different shaped
Containers containers are filled with water at a
constant rate.
Mr A. Coleman Glyn School
Topic: Real Life Graphs Example
1. Real Life Graphs that are supposed to model some
Graphs real-life situation.
The actual meaning of the values depends
on the labels and units on each axis.
The gradient might have a contextual
meaning.
The y-intercept might have a contextual
meaning.
The area under the graph might have a
contextual meaning.
A graph showing the cost of hiring a
ladder for various numbers of days.
The gradient shows the cost per day. It
costs £3/day to hire the ladder.
The y-intercept shows the additional
cost/deposit/fixed charge (something
not linked to how long the ladder is
hired for). The additional cost is £7.
2. Conversion A line graph to convert one unit to
Graph another.
Can be used to convert units (eg. miles and
kilometres) or currencies ($ and £)
Find the value you know on one axis, read
up/across to the conversion line and read
the equivalent value from the other axis.
8 km=5 miles
3. Depth of Graphs can be used to show how the depth
Water in of water changes as different shaped
Containers containers are filled with water at a
constant rate.
Mr A. Coleman Glyn School