Examen
Week 2 Graphs Homework Help Questions and Answers.
Puntuación
Vendido
-
Páginas
20
Grado
A
Subido en
12-07-2022
Escrito en
2021/2022
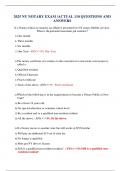
1. A data set is summarized in the frequency table below. Using the table, determine the number of values less than or equal to 5. Give your answer as a single number. For example if you found the number of values was 19, you would enter 19. Value Frequency 3 9 4 4 5 3 6 7 7 6 8 3 9 3 10 5 11 4 Provide your answer below: 16
Mostrar más
Leer menos
Institución
Chamberlain College Nursing
Grado
MATH 225N MATH
Ups! No podemos cargar tu documento ahora. Inténtalo de nuevo o contacta con soporte.
Escuela, estudio y materia
- Institución
-
Chamberlain College Nursing
- Grado
-
MATH 225N MATH
Información del documento
- Subido en
- 12 de julio de 2022
- Número de páginas
- 20
- Escrito en
- 2021/2022
- Tipo
- Examen
- Contiene
- Preguntas y respuestas
Temas
- graphs homework
-
week 2 graphs homework help questions and answers
$9.49
Accede al documento completo:
100% de satisfacción garantizada
Inmediatamente disponible después del pago
Tanto en línea como en PDF
No estas atado a nada