Fatigue Failure from Variable Loading
Stresses change over time therefore it becomes variable loading. There are micro cracks, that cause
stresses that grow over time slowly, which become macro cracks which cause failure. The methods we
use in this chapter are quick or inaccurate.
At the surface is where you have the biggest stresses.
Stress-Life Method
We compute stress in component. Then we use the method to give us the expected life of the
component. Life is number of cycles (n). Therefore, it is the number of cycles we expect the component
to undergo before it fails. This is the most inaccurate but quickest method, the other methods require
more data but are more accurate.
Even if the stresses are substantially smaller than yield strength, if you apply that load, after enough
time, the component will fail. This was determined using experimental observation.
Strain-Life Method
Compute strain life quantities.
Linear-Elastic Fracture Method
Calculate crack lengths. When it reaches critical crack length, the component will fail.
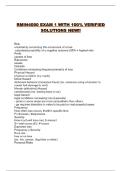
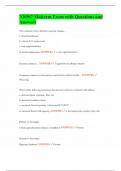
Moore Rotating-Beam Machine
Between the 2 inner forces F, we have a uniform bending moment. As we move to the centre, the stress
increases because the cross-section decreases. We then measure how many rotations it takes for the
component to break. Then we increase the forces and measure number of rotations again. We repeat
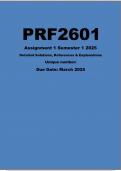
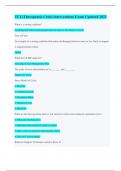
this and get a graph. The graph is Fatigue Strength vs Number of Cycles. It is a log-log scale. This is based
off of experimental evidence. The flat part of the graph is the endurance limit/ endurance strength (Se).
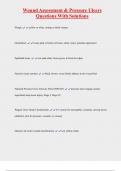
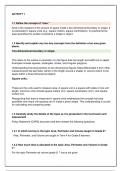
,For aluminium alloys the graph looks like this.
There is an increase in life as bending moment applied is reduced.
Sf is fatigue strength.
Important to Note
As noted previously, it is always good engineering practice to conduct a testing program on the materials to be
employed in design and manufacture. This, in fact, is a requirement, not an option, in guarding against the
possibility of a fatigue failure. Because of this necessity for testing, it would really be unnecessary for us to proceed
any further in the study of fatigue failure except for one important reason: the desire to know why fatigue failures
occur so that the most effective method or methods can be used to improve fatigue strength. Thus our primary
purpose in studying fatigue is to understand why failures occur so that we can guard against them in an optimum
manner. For this reason, the deterministic analysis presented in this chapter does not yield absolutely precise results.
The results should be taken as a guide, as something that indicates what is important and what is not important in
designing against fatigue failure.
We need to know the reasons/factors that affect premature failure so we can improve our designs.
, Endurance Limit
The determination of endurance limits by fatigue testing is now routine, though a lengthy procedure. Generally,
stress testing is preferred to strain testing for endurance limits. For preliminary and prototype design and for some
failure analysis as well, a quick method of estimating endurance limits is needed.
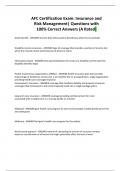
We need to estimate Se quickly without having to do experiments. Estimations are not accurate though.
Therefore, we use the dashed line.
The equation of the dashed line is:
Sut is ultimate tensile strength.
This is the endurance limit of the moore sample (That’s what the apostrophe means).
Fatigue Strength
From 100 cycles to 1 000 000 cycles, the strength is the fatigue strength (Sf). Beyond 1 000 000 cycles
the strength is Se.
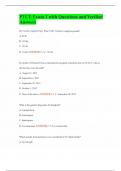
Use strength sheet in excel to find f and generate a graph (under the heading S-N graph).
We are trying to find a rough estimate for an SN graph instead of having to conduct many experiments
to find it.
Stresses change over time therefore it becomes variable loading. There are micro cracks, that cause
stresses that grow over time slowly, which become macro cracks which cause failure. The methods we
use in this chapter are quick or inaccurate.
At the surface is where you have the biggest stresses.
Stress-Life Method
We compute stress in component. Then we use the method to give us the expected life of the
component. Life is number of cycles (n). Therefore, it is the number of cycles we expect the component
to undergo before it fails. This is the most inaccurate but quickest method, the other methods require
more data but are more accurate.
Even if the stresses are substantially smaller than yield strength, if you apply that load, after enough
time, the component will fail. This was determined using experimental observation.
Strain-Life Method
Compute strain life quantities.
Linear-Elastic Fracture Method
Calculate crack lengths. When it reaches critical crack length, the component will fail.
Moore Rotating-Beam Machine
Between the 2 inner forces F, we have a uniform bending moment. As we move to the centre, the stress
increases because the cross-section decreases. We then measure how many rotations it takes for the
component to break. Then we increase the forces and measure number of rotations again. We repeat
this and get a graph. The graph is Fatigue Strength vs Number of Cycles. It is a log-log scale. This is based
off of experimental evidence. The flat part of the graph is the endurance limit/ endurance strength (Se).
,For aluminium alloys the graph looks like this.
There is an increase in life as bending moment applied is reduced.
Sf is fatigue strength.
Important to Note
As noted previously, it is always good engineering practice to conduct a testing program on the materials to be
employed in design and manufacture. This, in fact, is a requirement, not an option, in guarding against the
possibility of a fatigue failure. Because of this necessity for testing, it would really be unnecessary for us to proceed
any further in the study of fatigue failure except for one important reason: the desire to know why fatigue failures
occur so that the most effective method or methods can be used to improve fatigue strength. Thus our primary
purpose in studying fatigue is to understand why failures occur so that we can guard against them in an optimum
manner. For this reason, the deterministic analysis presented in this chapter does not yield absolutely precise results.
The results should be taken as a guide, as something that indicates what is important and what is not important in
designing against fatigue failure.
We need to know the reasons/factors that affect premature failure so we can improve our designs.
, Endurance Limit
The determination of endurance limits by fatigue testing is now routine, though a lengthy procedure. Generally,
stress testing is preferred to strain testing for endurance limits. For preliminary and prototype design and for some
failure analysis as well, a quick method of estimating endurance limits is needed.
We need to estimate Se quickly without having to do experiments. Estimations are not accurate though.
Therefore, we use the dashed line.
The equation of the dashed line is:
Sut is ultimate tensile strength.
This is the endurance limit of the moore sample (That’s what the apostrophe means).
Fatigue Strength
From 100 cycles to 1 000 000 cycles, the strength is the fatigue strength (Sf). Beyond 1 000 000 cycles
the strength is Se.
Use strength sheet in excel to find f and generate a graph (under the heading S-N graph).
We are trying to find a rough estimate for an SN graph instead of having to conduct many experiments
to find it.