Chapter 1
The Development Gap
1. First of all, in 1980, data are missing for many countries, in particular for the former
Soviet Union but also on different continents.
Second, over time, some countries get covered in a darker blue meaning that their
GDP per capita rises to a certain minimum level. This is the case for China for example.
Third, many countries, especially in Sub-Saharan Africa retain a light blue color,
meaning that their GDP per capita remains low. One can also make other observations.
For example, some countries’ color becomes lighter at times, meaning that they have not
been growing as fast as the average in the world economy. One may focus on a particular
set of countries to see how their color evolves over time. It is good for development
economics students to be able to identify countries on the world map.
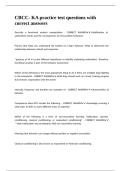
2. Here is the map for 1980.
Observations: There are no data for countries that were part of the Soviet block and for
some countries, mostly in Africa (Lybia, Somalia, Angola,….). The richer countries are
in North America, Europe, Australia, Japan. The poorer countries are in Sub-Saharan
Africa and Asia (China and India are among the poorest in this map).
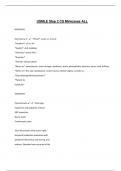
Let us now look at 2012.
Copyright © 2014 Pearson Education, Inc.
, Here, data are missing only for a few countries: Argentina, Greenland, Cuba, Libya, etc.
This is most likely because data for that year are not yet available for those countries.
Data from development countries are available much later than for the US or for
advanced economies. Here Sub-Saharan Africa is still among the poorest but India, and
mostly China, have improved their position. You may want to compare particular
countries and look at the precise data from the web site.
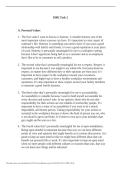
3. Below is one possible chart for 2005. Here, we ranked countries from richest to poorest.
Note that it is quite cumbersome to present a chart with that many data. Maps are better
here. The advantage of charts is that it gives an idea of the magnitudes. Looking directly
at the Excel table helps us also better see the numbers. We see a big inequality in income
per capita. The richest countries (Qatar, Luxembourg, etc.) have GDP per capita close to
$70,000 while the poorer half of countries have a GDP per capita of less than $7,000
while roughly 20 countries have a GDP per capita of less than $1,000.
A better way to make charts is to aggregate by regions or to choose a subsample
of countries from different continents.
Copyright © 2014 Pearson Education, Inc.
The Development Gap
1. First of all, in 1980, data are missing for many countries, in particular for the former
Soviet Union but also on different continents.
Second, over time, some countries get covered in a darker blue meaning that their
GDP per capita rises to a certain minimum level. This is the case for China for example.
Third, many countries, especially in Sub-Saharan Africa retain a light blue color,
meaning that their GDP per capita remains low. One can also make other observations.
For example, some countries’ color becomes lighter at times, meaning that they have not
been growing as fast as the average in the world economy. One may focus on a particular
set of countries to see how their color evolves over time. It is good for development
economics students to be able to identify countries on the world map.
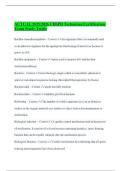
2. Here is the map for 1980.
Observations: There are no data for countries that were part of the Soviet block and for
some countries, mostly in Africa (Lybia, Somalia, Angola,….). The richer countries are
in North America, Europe, Australia, Japan. The poorer countries are in Sub-Saharan
Africa and Asia (China and India are among the poorest in this map).
Let us now look at 2012.
Copyright © 2014 Pearson Education, Inc.
, Here, data are missing only for a few countries: Argentina, Greenland, Cuba, Libya, etc.
This is most likely because data for that year are not yet available for those countries.
Data from development countries are available much later than for the US or for
advanced economies. Here Sub-Saharan Africa is still among the poorest but India, and
mostly China, have improved their position. You may want to compare particular
countries and look at the precise data from the web site.
3. Below is one possible chart for 2005. Here, we ranked countries from richest to poorest.
Note that it is quite cumbersome to present a chart with that many data. Maps are better
here. The advantage of charts is that it gives an idea of the magnitudes. Looking directly
at the Excel table helps us also better see the numbers. We see a big inequality in income
per capita. The richest countries (Qatar, Luxembourg, etc.) have GDP per capita close to
$70,000 while the poorer half of countries have a GDP per capita of less than $7,000
while roughly 20 countries have a GDP per capita of less than $1,000.
A better way to make charts is to aggregate by regions or to choose a subsample
of countries from different continents.
Copyright © 2014 Pearson Education, Inc.