
STATISTICS MILESTONE WITH RATIONALES
1
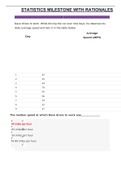
Dave drives to work. While driving the car over nine days, he observes his
daily average speed and lists it in the table below.
Average
Day Speed (MPH)
1 45
2 62
3 44
4 70
5 59
6 66
7 54
8 63
9 67
The median speed at which Dave drove to work was .
•
62 miles per hour
•
63 miles per hour
•
59 miles per hour
•
58.89 miles per hour
, STATISTICS MILESTONE WITH RATIONALES
RATIONALE
To get the median we first order the data and take the middle value. The
ordered values are:
Since there are an odd number (n=9) of values we simply take the middle,
which is 62 mph.
CONCEPT
, STATISTICS MILESTONE WITH RATIONALES
Mean, Median, and Mode
2
Katherine, Jonathan, and Ryan went bowling. Afterwards, two of them
decided to make bar graphs to plot their scores.
Who made Graph 2, and why?
•
Jonathan, because he wanted to make the scores appear reasonably close.
•
Katherine, because she wanted to accurately show each person's score.
•
Jonathan, because he wanted to make the scores appear very different.
•
Katherine, because she wanted to make the scores appear reasonably close.
RATIONALE
Since there was a competition, the person who most likely made this graph
would want to represent themselves favorably. Jonathan appears to be the
lowest scorer in both graphs, but in graph 2 it looks like he scored about the
same as Ryan and Katherine.
Jonathan probably made this graph to make it appear as if his score was
close to the others.
CONCEPT
Misleading Graphical Displays
3
In a poll of 300 preschoolers, 125 said they preferred chocolate ice cream, 71
said they preferred vanilla, 100 said they preferred cookies & cream, and 4
said they had never eaten ice cream.
If a pie chart were to be made showing the preference for each
flavor, the central angle for the chocolate ice cream sector would be
.
, STATISTICS MILESTONE WITH RATIONALES
•
41°
•
150°
1
Dave drives to work. While driving the car over nine days, he observes his
daily average speed and lists it in the table below.
Average
Day Speed (MPH)
1 45
2 62
3 44
4 70
5 59
6 66
7 54
8 63
9 67
The median speed at which Dave drove to work was .
•
62 miles per hour
•
63 miles per hour
•
59 miles per hour
•
58.89 miles per hour
, STATISTICS MILESTONE WITH RATIONALES
RATIONALE
To get the median we first order the data and take the middle value. The
ordered values are:
Since there are an odd number (n=9) of values we simply take the middle,
which is 62 mph.
CONCEPT
, STATISTICS MILESTONE WITH RATIONALES
Mean, Median, and Mode
2
Katherine, Jonathan, and Ryan went bowling. Afterwards, two of them
decided to make bar graphs to plot their scores.
Who made Graph 2, and why?
•
Jonathan, because he wanted to make the scores appear reasonably close.
•
Katherine, because she wanted to accurately show each person's score.
•
Jonathan, because he wanted to make the scores appear very different.
•
Katherine, because she wanted to make the scores appear reasonably close.
RATIONALE
Since there was a competition, the person who most likely made this graph
would want to represent themselves favorably. Jonathan appears to be the
lowest scorer in both graphs, but in graph 2 it looks like he scored about the
same as Ryan and Katherine.
Jonathan probably made this graph to make it appear as if his score was
close to the others.
CONCEPT
Misleading Graphical Displays
3
In a poll of 300 preschoolers, 125 said they preferred chocolate ice cream, 71
said they preferred vanilla, 100 said they preferred cookies & cream, and 4
said they had never eaten ice cream.
If a pie chart were to be made showing the preference for each
flavor, the central angle for the chocolate ice cream sector would be
.
, STATISTICS MILESTONE WITH RATIONALES
•
41°
•
150°

