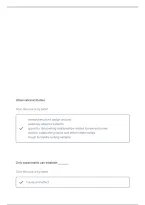
Observational Studies
Give this one a try later!
- researchers don't assign choices
- passively observe subjects
- good for discovering relationships related to rare outcomes
- bad for establishing cause and effect relationships
- tough to handle lurking variable
Only experiments can establish ___________
Give this one a try later!
Cause and effect
, Range
Give this one a try later!
Maximun- minimum
Histogram
Give this one a try later!
A chart that displays quantitative data
- Great for seeing the distribution of data
Variance
Give this one a try later!
Measure of how far the data is spread out form the mean
Standard Deviation
Give this one a try later!
- A number that is close to the average distances that the y values are from
the mean
- If data values are close to the mean ( less spread out), then the standard
deviation will be small.
- If the data values are far from the mean ( more spread out) then the
Give this one a try later!
- researchers don't assign choices
- passively observe subjects
- good for discovering relationships related to rare outcomes
- bad for establishing cause and effect relationships
- tough to handle lurking variable
Only experiments can establish ___________
Give this one a try later!
Cause and effect
, Range
Give this one a try later!
Maximun- minimum
Histogram
Give this one a try later!
A chart that displays quantitative data
- Great for seeing the distribution of data
Variance
Give this one a try later!
Measure of how far the data is spread out form the mean
Standard Deviation
Give this one a try later!
- A number that is close to the average distances that the y values are from
the mean
- If data values are close to the mean ( less spread out), then the standard
deviation will be small.
- If the data values are far from the mean ( more spread out) then the