WGU D601 | DATA STORYTELLING FOR VARIED AUDIENCES | TASK 2
WGU D601
DATA STORYTELLING FOR VARIED AUDIENCES
TASK 2
Multimedia Dashboard Presentation &
Reflection
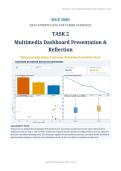
Telecommunications Customer Retention Executive Story
ALIGNMENT NOTE
Prepared as an independent September 2026 performance-assessment model based on the same representative
dashboard used for Task 1. The live WGU submission requires learner-specific recording evidence and an authentic
presenter introduction/background. This document supplies the presentation structure, narration model, dashboard
demonstration sequence, reflection, and submission checks; it does not claim an evaluator-issued result.
September 2026 alignment model | Page 1
, WGU D601 | DATA STORYTELLING FOR VARIED AUDIENCES | TASK 2
Executive Summary
Task 2 converts the Task 1 dashboard into a concise multimedia data story. The presentation is designed to demonstrate
not only what the dashboard shows, but also why its visual and interaction choices are appropriate for a defined
audience and how the evidence supports a business decision. Current 2026 learner reports indicate that the presenter
should explicitly introduce themselves and provide relevant background, demonstrate the same dashboard, address
audience expectations, and include the requested reflection within the presentation when the portal wording places
those elements together.
Presentation element Implemented approach
Same telecommunications retention dashboard developed for
Dashboard
Task 1
Technical/analytics peers with enough context to evaluate
Primary presentation audience
design and evidence
Executive and retention leaders who need concise, decision-
Business audience discussed
oriented information
KPIs, State and Contract filters, four visualizations, cross-
Demonstration
filtering/story sequence
Problem scale -> concentration of risk -> market context ->
Story arc
financial exposure -> action
What worked, what was adapted for differing audience needs,
Reflection
and what would be improved
Replace the presenter-background placeholder with truthful
Learner-specific requirement
personal background before recording
Recommended delivery length
A focused recording can usually cover the evidence in roughly 7-10 minutes if each section is addressed directly. The
current learner portal remains the controlling source for any stated minimum or maximum recording length.
September 2026 alignment model | Page 2
, WGU D601 | DATA STORYTELLING FOR VARIED AUDIENCES | TASK 2
1. September 2026 Course and Task Alignment
WGU lists D601 - Data Storytelling for Varied Audiences as an active 3-CU course in the September 2026 Institutional
Catalog. The course description emphasizes communicating observations and patterns to diverse stakeholders,
motivating change, answering business problems, and using data visualizations, interactive dashboards, interpersonal
communication, and presentation skills.
Public learner evidence from 2025-2026 consistently identifies Task 2 as a multimedia presentation using the dashboard
created in Task 1. A February 2026 learner discussion reproduces wording that Task 2 begins by asking the learner to
use the same dashboard to create a multimedia presentation and later asks the learner to present a reflection. A May
2026 evaluator report further shows that the introduction is expected to include both the presenter and the presenter's
background, not only a name.
Current evidence Practical implication for this model
All narrative and demonstration steps use the Task 1 telecom
Same dashboard
dashboard.
The document is structured as a recording storyboard with
Multimedia presentation
exact screen actions and narration.
A dedicated opening script includes a required learner-specific
Presenter introduction/background
replacement field.
The presentation explicitly contrasts technical and
Varied audiences
nontechnical/executive expectations.
The final recording segment reflects on communication choices,
Reflection
effectiveness, and improvements.
Filters, KPIs, visual interactions, accessibility, and data-story
Dashboard demonstration
sequence are shown on screen.
Authority hierarchy
For an actual submission, the task directions and rubric visible inside the learner portal on the submission date
control. Public portfolio and learner reports are useful corroborating evidence, but they are not substitutes for the
current portal text.
September 2026 alignment model | Page 3