

MATHEMATICS
Statistics
AQA 8300 | Premium Learning Edition
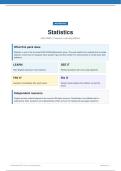
What this pack does
Statistics is one of the six broad AQA GCSE Mathematics areas. This pack teaches the methods that sit inside
statistics, shows how to recognise each question type and then builds from short practice to mixed exam-style
problems.
LEARN SEE IT
Plain-English teaching in short sections. Worked questions with every step explained.
TRY IT FIX IT
Questions immediately after each lesson. Answer sheet explains the method, not just the
result.
Independent resource
Original revision material aligned to the current AQA topic structure. ClearGrade is not affiliated with or
endorsed by AQA. Questions are independently written and are not reproduced past-paper questions.
ClearGrade GCSE | Premium Learning Edition Mathematics | 1
, Before you start
Statistics is one of the six broad AQA GCSE Mathematics areas. This pack teaches the methods that sit inside
statistics, shows how to recognise each question type and then builds from short practice to mixed exam-style
problems.
By the end of this pack, you should be able to:
• explain and apply types of data and sampling
• explain and apply mean, median, mode and range
• explain and apply frequency tables
• explain and apply grouped data and estimated mean
• explain and apply scatter graphs
• explain and apply time series
• explain and apply cumulative frequency
• explain and apply box plots
• explain and apply histograms
How to use the pack
1. Read one lesson. 2. Cover the page and explain it from memory. 3. Study the worked example. 4. Attempt
the three “Your turn” questions without looking back. 5. Mark them using the explained answers at the back. 6.
Re-do every question you got wrong.
ClearGrade GCSE | Premium Learning Edition Mathematics | 2
, LESSON 1
Types of data and sampling
The idea in plain English
Good statistics starts with appropriate data collection. Samples should represent the population.
What you need to know
• Primary data is collected first-hand; secondary data already exists.
• Random sampling reduces selection bias.
• Stratified sampling preserves subgroup proportions.
WORKED EXAMPLE
Question: 900 pupils include540 in KS4. A stratified sample has75 pupils. How many KS4?
Step 1: Proportion KS4=540/900.
Step 2: Multiply sample size:540/900x75.
Step 3: =45.
Step 4: So select45 KS4 pupils using an unbiased method within that group.
EXAM TIP COMMON MISTAKE
Write enough working that another student could Do not jump straight to a remembered shortcut if
follow your method. Calculator answers without a you cannot explain why it applies. Write the rule
setup can lose method marks. first.
YOUR TURN
1. 400 people,240 adults,sample50 adults? [1-2 marks]
2. Why random sample? [2-3 marks]
3. What is a census? [3-4 marks]
LESSON 2
Mean, median, mode and range
The idea in plain English
Measures of centre describe a typical value; measures of spread describe variability.
What you need to know
• Mean uses all values but is sensitive to extremes.
• Median is the middle value and is resistant to outliers.
• Range=max-min.
ClearGrade GCSE | Premium Learning Edition Mathematics | 3
Statistics
AQA 8300 | Premium Learning Edition
What this pack does
Statistics is one of the six broad AQA GCSE Mathematics areas. This pack teaches the methods that sit inside
statistics, shows how to recognise each question type and then builds from short practice to mixed exam-style
problems.
LEARN SEE IT
Plain-English teaching in short sections. Worked questions with every step explained.
TRY IT FIX IT
Questions immediately after each lesson. Answer sheet explains the method, not just the
result.
Independent resource
Original revision material aligned to the current AQA topic structure. ClearGrade is not affiliated with or
endorsed by AQA. Questions are independently written and are not reproduced past-paper questions.
ClearGrade GCSE | Premium Learning Edition Mathematics | 1
, Before you start
Statistics is one of the six broad AQA GCSE Mathematics areas. This pack teaches the methods that sit inside
statistics, shows how to recognise each question type and then builds from short practice to mixed exam-style
problems.
By the end of this pack, you should be able to:
• explain and apply types of data and sampling
• explain and apply mean, median, mode and range
• explain and apply frequency tables
• explain and apply grouped data and estimated mean
• explain and apply scatter graphs
• explain and apply time series
• explain and apply cumulative frequency
• explain and apply box plots
• explain and apply histograms
How to use the pack
1. Read one lesson. 2. Cover the page and explain it from memory. 3. Study the worked example. 4. Attempt
the three “Your turn” questions without looking back. 5. Mark them using the explained answers at the back. 6.
Re-do every question you got wrong.
ClearGrade GCSE | Premium Learning Edition Mathematics | 2
, LESSON 1
Types of data and sampling
The idea in plain English
Good statistics starts with appropriate data collection. Samples should represent the population.
What you need to know
• Primary data is collected first-hand; secondary data already exists.
• Random sampling reduces selection bias.
• Stratified sampling preserves subgroup proportions.
WORKED EXAMPLE
Question: 900 pupils include540 in KS4. A stratified sample has75 pupils. How many KS4?
Step 1: Proportion KS4=540/900.
Step 2: Multiply sample size:540/900x75.
Step 3: =45.
Step 4: So select45 KS4 pupils using an unbiased method within that group.
EXAM TIP COMMON MISTAKE
Write enough working that another student could Do not jump straight to a remembered shortcut if
follow your method. Calculator answers without a you cannot explain why it applies. Write the rule
setup can lose method marks. first.
YOUR TURN
1. 400 people,240 adults,sample50 adults? [1-2 marks]
2. Why random sample? [2-3 marks]
3. What is a census? [3-4 marks]
LESSON 2
Mean, median, mode and range
The idea in plain English
Measures of centre describe a typical value; measures of spread describe variability.
What you need to know
• Mean uses all values but is sensitive to extremes.
• Median is the middle value and is resistant to outliers.
• Range=max-min.
ClearGrade GCSE | Premium Learning Edition Mathematics | 3

