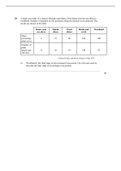
20. A study was made of a transect through sand dunes, from dunes near the sea-shore to
woodland. Samples of quadrats at five positions along the transect were analysed. The
results are shown in the table.
Dunes near Mobile Fixed Heath and Woodland
sea-shore dunes dunes scrub
Mean
percentage 2 25 90 100 100
plant cover
Number of
plant
species per 12 36 95 140 92
unit area
Pollard, Hooper and Moore Hedges Collins 1974.
(i) Woodland is the final stage in this ecological succession. Give the term used to
describe the final stage in an ecological succession.
.....................................................................................................................................
(1)
, (ii) The number of plant species per unit area in the woodland is less than that in the
heath and scrub. Suggest an explanation for this.
.....................................................................................................................................
.....................................................................................................................................
.....................................................................................................................................
.....................................................................................................................................
(2)
(Total 3 marks)
21. Answers should be written in continuous prose, where appropriate.
Quality of Written Communication will be assessed in these answers.
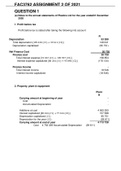
The waste material from coal mines is deposited in pit heaps. A particular mine closed
and the colonisation of an area of its pit heap was studied for a period of 80 years.
Species of plants that were found growing on the pit heap were recorded in two
categories, short-lived plants that grow for one or two years before dying and long-lived
plants that continue to grow for several years. The graph shows the percentages of short-
lived and long-lived plants on the pit heap.
100
80 L o n g -liv e d
p la n ts
P e rc e n ta g e 6 0
o f to ta l
p la n ts
c o u n te d
40
20 S h o r t- liv e d
p la n ts
0
0 10 20 30 40 50 60 70 80
A g e o f h e a p / y e a rs
, (a) Using your knowledge of succession, suggest explanations for the changes in the
percentages of short-lived and long-lived plants
(i) over the first 20 years;
..........................................................................................................................
.
..........................................................................................................................
.
..........................................................................................................................
.
..........................................................................................................................
.
..........................................................................................................................
.
..........................................................................................................................
.
..........................................................................................................................
.
..........................................................................................................................
.
(ii) between 30 and 80 years.
..........................................................................................................................
.
..........................................................................................................................
.
..........................................................................................................................
.
..........................................................................................................................
.
..........................................................................................................................
.
..........................................................................................................................
.
..........................................................................................................................
.
..........................................................................................................................
.
(6)
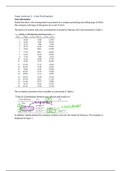
woodland. Samples of quadrats at five positions along the transect were analysed. The
results are shown in the table.
Dunes near Mobile Fixed Heath and Woodland
sea-shore dunes dunes scrub
Mean
percentage 2 25 90 100 100
plant cover
Number of
plant
species per 12 36 95 140 92
unit area
Pollard, Hooper and Moore Hedges Collins 1974.
(i) Woodland is the final stage in this ecological succession. Give the term used to
describe the final stage in an ecological succession.
.....................................................................................................................................
(1)
, (ii) The number of plant species per unit area in the woodland is less than that in the
heath and scrub. Suggest an explanation for this.
.....................................................................................................................................
.....................................................................................................................................
.....................................................................................................................................
.....................................................................................................................................
(2)
(Total 3 marks)
21. Answers should be written in continuous prose, where appropriate.
Quality of Written Communication will be assessed in these answers.
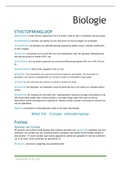
The waste material from coal mines is deposited in pit heaps. A particular mine closed
and the colonisation of an area of its pit heap was studied for a period of 80 years.
Species of plants that were found growing on the pit heap were recorded in two
categories, short-lived plants that grow for one or two years before dying and long-lived
plants that continue to grow for several years. The graph shows the percentages of short-
lived and long-lived plants on the pit heap.
100
80 L o n g -liv e d
p la n ts
P e rc e n ta g e 6 0
o f to ta l
p la n ts
c o u n te d
40
20 S h o r t- liv e d
p la n ts
0
0 10 20 30 40 50 60 70 80
A g e o f h e a p / y e a rs
, (a) Using your knowledge of succession, suggest explanations for the changes in the
percentages of short-lived and long-lived plants
(i) over the first 20 years;
..........................................................................................................................
.
..........................................................................................................................
.
..........................................................................................................................
.
..........................................................................................................................
.
..........................................................................................................................
.
..........................................................................................................................
.
..........................................................................................................................
.
..........................................................................................................................
.
(ii) between 30 and 80 years.
..........................................................................................................................
.
..........................................................................................................................
.
..........................................................................................................................
.
..........................................................................................................................
.
..........................................................................................................................
.
..........................................................................................................................
.
..........................................................................................................................
.
..........................................................................................................................
.
(6)