ELEMENTARY STATS EXAM
QUESTIONS AND ANSWERS
1.-To-examine-the-relationship-between-two-variables,-the-variables-must-be-measured-
from-the-same-_______.
A)-cases-B)-labels-C)-units-D)-values---ans-✔✔A
2.-A-particularly-common-question-in-the-study-of-wildlife-behavior-involves-observing-
contests-between-"residents"
of-a-particular-area-and-"intruders."-In-each-contest,-the-residents-either-win-or-lose-the-
encounter-(assuming-there
are-no-ties).-Observers-might-record-several-variables,-some-of-which-are-listed-below.-
Which-of-these-variables-is
categorical?
A)-The-duration-of-the-contest-(in-seconds)-
B)-The-number-of-animals-involved-in-the-contest
C)-Whether-the-residents-win-or-lose
-D)-The-total-number-of-contests-won-by-the-residents---ans-✔✔C
3.-Variables-that-take-numeric-values-for-which-arithmetic-operations-make-sense-are-
called-_______.
A)-quantitative-B)-categorical-C)-distributions-D)-cases---ans-✔✔A
We-have-a-data-set-where-the-cases-are-college-students.-One-of-the-variables-in-the-
data-set-is-"age-of-the-student."
What-type-of-variable-is-age-of-the-student?
A)-Quantitative
B)-Categorical-
-C)-Quantitative-and-categorical
D)-None-of-the-above---ans-✔✔A
5.-Suppose-you-own-a-pizza-delivery-company-and-you-are-trying-to-determine-the-best-
campus-on-which-to-sell
pizza.-What-would-be-the-best-measurement-to-make-the-comparison?
A)-Average-number-of-pizzas-purchased-
,B)-Count-of-pizzas-purchased-
C)-Rate-of-pizzas-purchased
D)-None-of-the-above---ans-✔✔B
6.-Quantitative-variables-are-best-displayed-using-_______.
A)-stemplots-
B)-pie-charts
C)-bar-graphs-
D)-pie-charts-or-bar-graphs---ans-✔✔A
7.-Large-data-sets-with-quantitative-variables-are-best-displayed-using-________.
A)-stemplots
B)-histograms-
-C)-stemplots-and-histograms
D)-none-of-the-above---ans-✔✔B
8.-Below-is-a-data-set-with-information-on-students-in-a-basic-statistics-class-at-a-local-
university.-What-is-a-key
characteristic-of-the-data-set?
Student-ID-GPA-Hometown-Major
23455-3.1-Chicago-Math
23672-3.2-DC-Statistics
4572-4-Atlanta-Applied-Math
89675-2.1-Kansas-City-Undeclared
65546-3.2-New-York-City-Biology
7789-2.8-Raleigh-Biology
90956-2.2-Santa-Monica-Statistics
56378-3-Richmond-History
36455-3.8-Dallas-Physics
46456-11.1-Austin-Anthropology
A)-There-are-10-students-in-the-data-set.
B)-The-data-describe-students-in-a-class.
-C)-There-are-three-variables-in-the-data-set.-
D)-All-of-the-above---ans-✔✔D
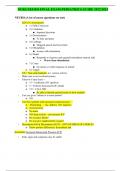
A-distributor-of-electronics-is-doing-a-customer-satisfaction-survey-for-a-manufacturer-of-
tablet-computers.-A
sample-of-68-clients-is-asked-to-rate-a-particular-tablet-on-appearance,-functionality,-ease-
of-use,-and-price-on-a
scale-of-1-to-10,-where-1-corresponds-to-the-worst-rating-and-10-to-the-best-possible-
rating.-A-bar-graph-of-the-ease
of-use-ratings-classified-by-gender-is-given-below.
What-percentage-of-the-sampled-female-clients-rated-the-tablet-as-not-so-easy-to-use-(a-
rating-of-4-or-lower)?
A)-28%-B)-29%-C)-38%-D)-62%---ans-✔✔C
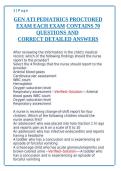
, 10.-In-a-statistics-class-with-136-students,-the-professor-records-how-much-money-each-
student-has-in-their
possession-during-the-first-class-of-the-semester.-The-histogram-shown-below-represents-
the-data-he-collected.
What-is-approximately-the-number-of-students-with-$30-or-more-in-their-possession?
A)-Less-than-5-B)-About-10-C)-About-30-D)-More-than-100---ans-✔✔B
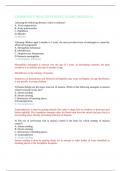
11.-During-the-early-part-of-the-1994-baseball-season,-many-sports-fans-and-baseball-
players-noticed-that-the-number
of-home-runs-being-hit-seemed-to-be-unusually-large.-Below-are-separate-stemplots-for-
the-number-of-home-runs
by-American-League-and-National-League-teams-based-on-the-team-by-team-statistics-
on-home-runs-hit-through
Friday,-June-3,-1994-(from-the-Columbus-Dispatch,-Sunday,-June-5,-1994).
Legend:-2|9-represents-29.
What-is-the-mean-for-the-number-of-home-runs-for-the-National-League-teams?
A)-45-B)-50-C)-50.1-D)-57.5---ans-✔✔C
12.-In-the-fuel-efficiency-study-of-2007-compact-model-automobiles,-the-following-
histogram-of-the-distribution-of-the
miles-per-gallon-fuel-efficiency-rating-in-city-driving-(MPG-City)-for-automobiles-
manufactured-in-Europe-was
obtained.
From-the-histogram-above,-showing-the-distribution-of-MPG-City,-we-can-see-that-the
A)-shape-of-the-distribution-is-roughly-symmetric-with-one-peak.
B)-distribution-is-skewed-to-the-left.
C)-distribution-is-skewed-to-the-right.
D)-distribution-is-roughly-symmetric-with-outlier-values-to-the-left.
E)-shape-of-the-distribution-would-be-easier-to-see-if-a-stemplot-had-been-constructed-
instead-of-the-histogram.---ans-✔✔B
13.-The-World-Malaria-Report-(2008)-has-information-on-the-number-of-reported-malaria-
cases-from-2005-and-2006
for-the-10-countries-listed-in-West-Africa.-The-data-are-presented-in-the-table-below.
Country/area-2005-2006
Benin-803,462-861,847
Burkina-Faso-1,615,695-2,060,867
Côte-d'Ivoire-1,280,914-1,253,408
Gambia-161,698-266,188
Ghana-3,452,969-3,511,452
Liberia-116,681-1,105,272
Mali-962,706-1,022,592
Senegal-1,346,158-1,555,310
Sierra-Leone-233,833-160,666
Togo-437,662-566,450
QUESTIONS AND ANSWERS
1.-To-examine-the-relationship-between-two-variables,-the-variables-must-be-measured-
from-the-same-_______.
A)-cases-B)-labels-C)-units-D)-values---ans-✔✔A
2.-A-particularly-common-question-in-the-study-of-wildlife-behavior-involves-observing-
contests-between-"residents"
of-a-particular-area-and-"intruders."-In-each-contest,-the-residents-either-win-or-lose-the-
encounter-(assuming-there
are-no-ties).-Observers-might-record-several-variables,-some-of-which-are-listed-below.-
Which-of-these-variables-is
categorical?
A)-The-duration-of-the-contest-(in-seconds)-
B)-The-number-of-animals-involved-in-the-contest
C)-Whether-the-residents-win-or-lose
-D)-The-total-number-of-contests-won-by-the-residents---ans-✔✔C
3.-Variables-that-take-numeric-values-for-which-arithmetic-operations-make-sense-are-
called-_______.
A)-quantitative-B)-categorical-C)-distributions-D)-cases---ans-✔✔A
We-have-a-data-set-where-the-cases-are-college-students.-One-of-the-variables-in-the-
data-set-is-"age-of-the-student."
What-type-of-variable-is-age-of-the-student?
A)-Quantitative
B)-Categorical-
-C)-Quantitative-and-categorical
D)-None-of-the-above---ans-✔✔A
5.-Suppose-you-own-a-pizza-delivery-company-and-you-are-trying-to-determine-the-best-
campus-on-which-to-sell
pizza.-What-would-be-the-best-measurement-to-make-the-comparison?
A)-Average-number-of-pizzas-purchased-
,B)-Count-of-pizzas-purchased-
C)-Rate-of-pizzas-purchased
D)-None-of-the-above---ans-✔✔B
6.-Quantitative-variables-are-best-displayed-using-_______.
A)-stemplots-
B)-pie-charts
C)-bar-graphs-
D)-pie-charts-or-bar-graphs---ans-✔✔A
7.-Large-data-sets-with-quantitative-variables-are-best-displayed-using-________.
A)-stemplots
B)-histograms-
-C)-stemplots-and-histograms
D)-none-of-the-above---ans-✔✔B
8.-Below-is-a-data-set-with-information-on-students-in-a-basic-statistics-class-at-a-local-
university.-What-is-a-key
characteristic-of-the-data-set?
Student-ID-GPA-Hometown-Major
23455-3.1-Chicago-Math
23672-3.2-DC-Statistics
4572-4-Atlanta-Applied-Math
89675-2.1-Kansas-City-Undeclared
65546-3.2-New-York-City-Biology
7789-2.8-Raleigh-Biology
90956-2.2-Santa-Monica-Statistics
56378-3-Richmond-History
36455-3.8-Dallas-Physics
46456-11.1-Austin-Anthropology
A)-There-are-10-students-in-the-data-set.
B)-The-data-describe-students-in-a-class.
-C)-There-are-three-variables-in-the-data-set.-
D)-All-of-the-above---ans-✔✔D
A-distributor-of-electronics-is-doing-a-customer-satisfaction-survey-for-a-manufacturer-of-
tablet-computers.-A
sample-of-68-clients-is-asked-to-rate-a-particular-tablet-on-appearance,-functionality,-ease-
of-use,-and-price-on-a
scale-of-1-to-10,-where-1-corresponds-to-the-worst-rating-and-10-to-the-best-possible-
rating.-A-bar-graph-of-the-ease
of-use-ratings-classified-by-gender-is-given-below.
What-percentage-of-the-sampled-female-clients-rated-the-tablet-as-not-so-easy-to-use-(a-
rating-of-4-or-lower)?
A)-28%-B)-29%-C)-38%-D)-62%---ans-✔✔C
, 10.-In-a-statistics-class-with-136-students,-the-professor-records-how-much-money-each-
student-has-in-their
possession-during-the-first-class-of-the-semester.-The-histogram-shown-below-represents-
the-data-he-collected.
What-is-approximately-the-number-of-students-with-$30-or-more-in-their-possession?
A)-Less-than-5-B)-About-10-C)-About-30-D)-More-than-100---ans-✔✔B
11.-During-the-early-part-of-the-1994-baseball-season,-many-sports-fans-and-baseball-
players-noticed-that-the-number
of-home-runs-being-hit-seemed-to-be-unusually-large.-Below-are-separate-stemplots-for-
the-number-of-home-runs
by-American-League-and-National-League-teams-based-on-the-team-by-team-statistics-
on-home-runs-hit-through
Friday,-June-3,-1994-(from-the-Columbus-Dispatch,-Sunday,-June-5,-1994).
Legend:-2|9-represents-29.
What-is-the-mean-for-the-number-of-home-runs-for-the-National-League-teams?
A)-45-B)-50-C)-50.1-D)-57.5---ans-✔✔C
12.-In-the-fuel-efficiency-study-of-2007-compact-model-automobiles,-the-following-
histogram-of-the-distribution-of-the
miles-per-gallon-fuel-efficiency-rating-in-city-driving-(MPG-City)-for-automobiles-
manufactured-in-Europe-was
obtained.
From-the-histogram-above,-showing-the-distribution-of-MPG-City,-we-can-see-that-the
A)-shape-of-the-distribution-is-roughly-symmetric-with-one-peak.
B)-distribution-is-skewed-to-the-left.
C)-distribution-is-skewed-to-the-right.
D)-distribution-is-roughly-symmetric-with-outlier-values-to-the-left.
E)-shape-of-the-distribution-would-be-easier-to-see-if-a-stemplot-had-been-constructed-
instead-of-the-histogram.---ans-✔✔B
13.-The-World-Malaria-Report-(2008)-has-information-on-the-number-of-reported-malaria-
cases-from-2005-and-2006
for-the-10-countries-listed-in-West-Africa.-The-data-are-presented-in-the-table-below.
Country/area-2005-2006
Benin-803,462-861,847
Burkina-Faso-1,615,695-2,060,867
Côte-d'Ivoire-1,280,914-1,253,408
Gambia-161,698-266,188
Ghana-3,452,969-3,511,452
Liberia-116,681-1,105,272
Mali-962,706-1,022,592
Senegal-1,346,158-1,555,310
Sierra-Leone-233,833-160,666
Togo-437,662-566,450