

Escrito por estudiantes que aprobaron Inmediatamente disponible después del pago Leer en línea o como PDF ¿Documento equivocado? Cámbialo gratis 4,6 TrustPilot
logo-home
Document preview thumbnail
Vista previa 2 fuera de 8 páginas
Examen

Chapter 9: Visualizing Data | Data Science SSM Study Guide, Boxplot Analysis & Solutions 2026

Document preview thumbnail
Vista previa 2 fuera de 8 páginas

Chapter 9 Visualizing Data Critical Thinking [9.1, LO 9.1.1] 1. For the following five-number summary of a dataset of textbook cost per student per semester, create a horizontal boxplot. Minimum = $83First Quartile = $255Median = $481Third Quartile = $604Maximum = $793 Analyze the boxplot and comment on variability, symmetry, and skewness. Solution a: Python code: # import matplotlib import t as plt import numpy as np # Given values for the five-number summary minimum = 83 q1 = 255 median = 481 q3 = 604 maximum = 793 # Create a boxplot using the given values ot([[minimum, q1, median, q3, maximum]], vert=False, widths=0.1) # Add labels and title l('Textbook Cost ($)') ('Boxplot Showing Textbook Cost per Student per Semester') # Show the plot () This resource covers Chapter 9: Visualizing Data from Data Science SSM. It focuses on graphical representation of data to identify patterns, variability, and distribution shapes for better data interpretation and decision-making. Key topics include histograms, bar charts, boxplots, five-number summaries, measures of spread, outliers, skewness, and symmetry. It also introduces Python-based data visualization using libraries such as Matplotlib for creating and interpreting statistical plots.

Vista previa del contenido

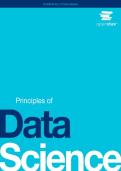
Principles of Data Science


11/5/24 For more free, peer-reviewed, openly licensed resources visit OpenStax.org. 1

, Principles of Data Science


Chapter 9
Visualizing Data

Critical Thinking
[9.1, LO 9.1.1]
1.
a. For the following five-number summary of a dataset of textbook cost per student per
semester, create a horizontal boxplot.
Minimum=$ 83 First Quartile=$ 255 Median=$ 481Third Quartile=$ 604 Maximum=$ 793
b. Analyze the boxplot and comment on variability, symmetry, and skewness.

Solution a:
Python code:
# import matplotlib

import matplotlib.pyplot as plt
import numpy as np

# Given values for the five-number summary
minimum = 83
q1 = 255
median = 481
q3 = 604
maximum = 793

# Create a boxplot using the given values
plt.boxplot([[minimum, q1, median, q3, maximum]], vert=False,
widths=0.1)

# Add labels and title
plt.xlabel('Textbook Cost ($)')
plt.title('Boxplot Showing Textbook Cost per Student per
Semester')

# Show the plot
plt.show()


11/5/24 For more free, peer-reviewed, openly licensed resources visit OpenStax.org. 2
Información del documento

Subido en
31 de mayo de 2026
Número de páginas
8
Escrito en
2025/2026
Tipo
Examen
Contiene
Preguntas y respuestas
$10.99

¿Documento equivocado? Cámbialo gratis Dentro de los 14 días posteriores a la compra y antes de descargarlo, puedes elegir otro documento. Puedes gastar el importe de nuevo.
Escrito por estudiantes que aprobaron
Inmediatamente disponible después del pago
Leer en línea o como PDF

Seller avatar
Los indicadores de reputación están sujetos a la cantidad de artículos vendidos por una tarifa y las reseñas que ha recibido por esos documentos. Hay tres niveles: Bronce, Plata y Oro. Cuanto mayor reputación, más podrás confiar en la calidad del trabajo del vendedor.
Vendido
21
Seguidores
0
Artículos
207
Última venta
1 día hace


Por qué los estudiantes eligen Stuvia

Creado por compañeros estudiantes, verificado por reseñas

Calidad en la que puedes confiar: escrito por estudiantes que aprobaron y evaluado por otros que han usado estos resúmenes.

¿No estás satisfecho? Elige otro documento

¡No te preocupes! Puedes elegir directamente otro documento que se ajuste mejor a lo que buscas.

Paga como quieras, empieza a estudiar al instante

Sin suscripción, sin compromisos. Paga como estés acostumbrado con tarjeta de crédito y descarga tu documento PDF inmediatamente.

Student with book image

“Comprado, descargado y aprobado. Así de fácil puede ser.”

Alisha Student

Preguntas frecuentes
