Statistics for Data Analytics Exam with
Accurate Solutions
Parametric Analysis - ANSWER-A classification of statistical inference tools based on
assumptions about the distribution of the population and a fixed set of parameters.
Name 4 parametric tests - ANSWER-1) One-way t-test 2) Paired t-test 3) Two-way t-test
4) Analysis of Variance (ANOVA)
One-way t-test - ANSWER-Determines whether the hypothesized mean is equal to the
true population mean.
Paired t-test - ANSWER-Used to compare two population means in the case where the
two samples are dependent.
Two-way t-test - ANSWER-Determines whether the population means are equal.
X ~ N(µ, σ) - ANSWER-Denotes that random variable X follows a NORMAL distribution
with population mean of µ and population standard deviation of σ. µ and σ are the two
parameters for a normal distribution.
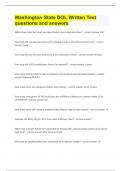
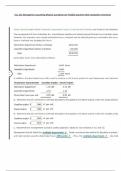
Equation for the probability distribution function for a Normal Distribution - ANSWER-
P(X < a) - ANSWER-Notation for the probability that the random variable X takes on a
value of at most a.
P(X > a) - ANSWER-Notation for the probability that the random variable X takes on a
value of at least a.
P(a < X < b) - ANSWER-Notation for the probability that the random variable X takes on
a value between a and b.
sampling distribution of the mean - ANSWER-The distribution of sample means when
taking random samples of the same size.
Central Limit Theorem (CLT) - ANSWER-States that as the sample size drawn from the
population with distribution X becomes larger, the distribution of the sample means
approaches that of a normal distribution.
Or, in other words:
, Says that when X is large, the sampling distribution of the sample mean is
approximately Normal
Note that for the central limit theorem to be used, the following assumptions and
conditions in addition to sample size must be satisfied:
-Randomness assumption - samples must be randomly selected.
-Independence condition - sample values must be independent from each other.
-Sample size assumption - sample size must be large enough. A rule of thumb is that
the sample size should be at least 30.
-10% condition - sample size must be at most 10% of the population size.
Student's t-distribution or t-distribution - ANSWER-Used in place of the normal
distribution in situations where the sample size (n) is small, or the population standard
deviation (σ) is unknown.
The t-distribution has one parameter, degrees of freedom or df, which is equal to n - 1.
As n increases, df increases, as well.
As df increases, the t-distribution approaches the normal distribution with mean of 0 and
standard deviation of 1.
A sample of data is skewed too much to use a t-test if the ratio of the skewness to the
standard error of skewness is too large. A sample is likely to be too skewed if this ratio
is around 2 or greater.
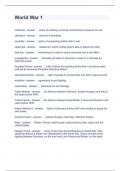
Standard error of skewness (SES) - ANSWER-The measure of the deviations that exist
between random subsamples selected from the data set, given by the formula in the
attached image, where n is the number of data points in the sample
Resampling - ANSWER-Nonparametric technique for determining statistical significance
by comparing an outcome with a set of outcomes obtained by randomly assigning the
data points among groups.
Randomization test (aka Permutation test) - ANSWER-A particular resampling
technique that permutes the data points to obtain the comparison set of random
outcomes, selecting each data point only once. A randomization test is classified as
random resampling without replacement, because the data point can no longer be
drawn from the population. Ex: One may wish to determine if males weigh more than
females, from a sample of two males weighing 140 and 170 pounds, and a sample of
two females weighing 130 and 150 (absurdly small samples, for illustration only). The
Accurate Solutions
Parametric Analysis - ANSWER-A classification of statistical inference tools based on
assumptions about the distribution of the population and a fixed set of parameters.
Name 4 parametric tests - ANSWER-1) One-way t-test 2) Paired t-test 3) Two-way t-test
4) Analysis of Variance (ANOVA)
One-way t-test - ANSWER-Determines whether the hypothesized mean is equal to the
true population mean.
Paired t-test - ANSWER-Used to compare two population means in the case where the
two samples are dependent.
Two-way t-test - ANSWER-Determines whether the population means are equal.
X ~ N(µ, σ) - ANSWER-Denotes that random variable X follows a NORMAL distribution
with population mean of µ and population standard deviation of σ. µ and σ are the two
parameters for a normal distribution.
Equation for the probability distribution function for a Normal Distribution - ANSWER-
P(X < a) - ANSWER-Notation for the probability that the random variable X takes on a
value of at most a.
P(X > a) - ANSWER-Notation for the probability that the random variable X takes on a
value of at least a.
P(a < X < b) - ANSWER-Notation for the probability that the random variable X takes on
a value between a and b.
sampling distribution of the mean - ANSWER-The distribution of sample means when
taking random samples of the same size.
Central Limit Theorem (CLT) - ANSWER-States that as the sample size drawn from the
population with distribution X becomes larger, the distribution of the sample means
approaches that of a normal distribution.
Or, in other words:
, Says that when X is large, the sampling distribution of the sample mean is
approximately Normal
Note that for the central limit theorem to be used, the following assumptions and
conditions in addition to sample size must be satisfied:
-Randomness assumption - samples must be randomly selected.
-Independence condition - sample values must be independent from each other.
-Sample size assumption - sample size must be large enough. A rule of thumb is that
the sample size should be at least 30.
-10% condition - sample size must be at most 10% of the population size.
Student's t-distribution or t-distribution - ANSWER-Used in place of the normal
distribution in situations where the sample size (n) is small, or the population standard
deviation (σ) is unknown.
The t-distribution has one parameter, degrees of freedom or df, which is equal to n - 1.
As n increases, df increases, as well.
As df increases, the t-distribution approaches the normal distribution with mean of 0 and
standard deviation of 1.
A sample of data is skewed too much to use a t-test if the ratio of the skewness to the
standard error of skewness is too large. A sample is likely to be too skewed if this ratio
is around 2 or greater.
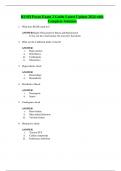
Standard error of skewness (SES) - ANSWER-The measure of the deviations that exist
between random subsamples selected from the data set, given by the formula in the
attached image, where n is the number of data points in the sample
Resampling - ANSWER-Nonparametric technique for determining statistical significance
by comparing an outcome with a set of outcomes obtained by randomly assigning the
data points among groups.
Randomization test (aka Permutation test) - ANSWER-A particular resampling
technique that permutes the data points to obtain the comparison set of random
outcomes, selecting each data point only once. A randomization test is classified as
random resampling without replacement, because the data point can no longer be
drawn from the population. Ex: One may wish to determine if males weigh more than
females, from a sample of two males weighing 140 and 170 pounds, and a sample of
two females weighing 130 and 150 (absurdly small samples, for illustration only). The