

1
Year 11 General Unit 1 2025
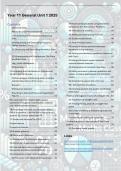
Contents 3H Financial Applications using Geometric
Univariate Data ........................................... 3 Sequences and Recurrence Relations ......... 38
Measures of Centre and Spread .................... 3 4A The basics of a matrix ............................ 45
2A Classifying and Displaying Categorical 4B Adding and subtracting matrices ............ 47
Data ........................................................... 7 4C Scalar multiplication ............................ 48
2B Interpreting and Describing Frequency 4D Matrix multiplication ............................. 49
Tables and Bar Charts.................................. 8 4E Inverse matrices and simultaneous
2C Displaying and Describing Numerical Data equations using matrices ........................... 51
................................................................ 10 4E Solving simultaneous equations (Matrices)
2D Characteristics of Distributions, Dot Plots with Tech .................................................. 52
and Stem Plots .......................................... 11 4F Using matrices to model road and
Log10 Scale Histograms .............................. 12 communication networks .......................... 53
2H Boxplots .............................................. 14 4G Introduction to transition matrices ......... 56
2I Comparing the Distribution of a Numerical 4H Using recursion to answer questions that
Variable Across Groups ................................. 16 require multiple applications of a transition
2G Percentages of data lying within multiple matrix ...................................................... 57
standard deviations of the mean ................. 17 5A Substituting values into a formula .......... 61
Revision ................................................... 19 5B: Solving linear equations ....................... 62
Writing your answers ................................. 21 5D: Drawing straight-line graphs and finding
Rounding to Decimal Places and Significant their slope ................................................ 63
Figures ..................................................... 24 Positive and negative slopes of a straight line .. 63
We need way more finance applications 5E: Equations of straight lines..................... 65
questions throughout. Depreciation, cost per 5F: Finding the equation of a straight-line
use, reducing balance loans. ......................... 25 graph ....................................................... 66
1B Percentage increase and decrease Need a 5G: Linear modelling & Interpreting slope and
find a % question. Like find the % discount on a y-intercept ................................................ 71
special. $2 product down from 5$ .................. 25
5H: Solving simultaneous equations ........... 76
1C Goods and Services Tax (GST) ................... 26
Finding the point of intersection of two linear
Simple Interest ............................................. 27 graphs ......................................................... 76
Compound Interest....................................... 28 5J: Piecewise linear graphs ......................... 77
3A Number patterns...................................... 29
3B Recurrence Relations ............................... 30 Links
3C Introduction to Arithmetic Sequences ........ 31
Vicmathsnotes weebly VCAA GeneralMathematics
3D Arithmetic sequences using recursion ....... 32 Study Design Past VCAA Exams
3E Financial Applications using Arithmetic https://www.vcaa.vic.edu.au/assessment/vce/authoris
Sequences and Recurrence Relations ............ 33 ed-materials-and-equipment#01
3F Introduction to Geometric Sequences ........ 34
3G Recursion with Geometric Sequences .... 36
, 2
Data Formula Sheet Normal Distribution
Median
𝑛+1
th result. Q2. 50% of the data is less than this value.
2
Median is less affected by outliers.
Mean
Mean is affected by outliers or skewed data. 𝑥̅
Range
The range (R) is Largest – smallest value.
Range is affected by outliers.
Interquartile Range
The interquartile range (IQR) gives the spread of the
middle 50% of data values in an ordered data set.
IQR=Q3−Q1 IQR is less affected by outliers. 𝑥 − 𝑥̅
z= 𝒙 = 𝒙̅ + 𝒛 × 𝒔
Box Plots and Fences 𝑠𝑥
The whisker finishes on the highest or smallest value that Skewness and Choosing
is within the upper and lower fences. If there’s outliers or skews, choose IQR/ Median.
LF: Q1−1.5×IQR. UF: Q3+1.5×IQR. Which was is the data stretched?
5-Fig Summary
𝑚𝑖𝑛, 𝑄1, 𝑀𝑒𝑑𝑖𝑎𝑛, 𝑄3, 𝑀𝑎𝑥
Types of Data
Logs
𝑆𝑐𝑎𝑙𝑒𝑑 = 𝐿𝑜𝑔10 (𝐴𝑐𝑡𝑢𝑎𝑙) <=> 10𝑆𝑐𝑎𝑙𝑒𝑑 = 𝐴𝑐𝑡𝑢𝑎𝑙
Data 0.01 0.1 1 10 100 1000
If the mean makes sense then numerical. If not Log
log10 (0.01) log10(0.1) log10 (1) log10 (10) log10 (100) log10(1000)
categorical. Known Categorical data sets are student Form
Log
number 1,2,3,4,5, postcodes 3911,3893, 3906,… scale
-2 -1 0 1 2 3
Response Explanatory Graph
Segmented bar chart
Categorical Categorical Parallel bar chart
Two-way freq.
Numerical Categorical Parallel box/dot plot
Only two Back-to-back stem plot
Numerical
categories Parallel box/dot plot
Numerical Numerical Scatterplot
, 3
Univariate Data
Measures of Centre and Spread
Mean 𝑥̅ : The mean (average) is calculated by adding up all values (∑x) and dividing by the number of values (n).
It’s preferable when data has no extreme outliers, as it can be easily affected by very high or low numbers.
∑𝑥
𝑥̅ = 𝑛
𝑛+1
Median (Q2): The median is the "middle" value in an ordered data set, located in the th position. If n is odd,
2
the median is the middle data value. If n is even, it is the mean of the two middle values. The median is a better
choice for skewed data or data with outliers, as it is not influenced by extreme values.
Mode: The mode is the value that appears most frequently in a data set. It’s most useful for categorical data or
when identifying the most common value in a set.
Find the mean, median and mode for the number of hours worked by 17-year-olds over the summer break per
week as shown in the dot plot.
Which measure of centre best represents the number of hours worked by the group?
A measure of spread is calculated to judge the variability of a data set. That is, are most of the values
clustered together, or are they spread out? Measures or spread include Range, IQR and standard deviation.
Range (R): the range is affected by outliers. 𝑅 = 𝑀𝑎𝑥 − 𝑚𝑖𝑛.
Find the range of the marks from Task A
Notice that we have 2 extreme values here. Is the range affected by these values?
, 4
Interquartile Range IQR
Another measure of spread is needed, one which is not so influenced by extreme values. In the case of any
outliers, we prefer to use IQR. The statistic we use for this task is the interquartile range. Find the IQR with
data an even numbered data set:
81, 85, 64, 57, 48, 72, 88, 77, 76, 52
Step 1: Order your values from low to high.
__, __, __, __, __, __, __, __, __, __.
Step 2: Locate the median, and then separate the values below it from the values above it.
With an even-numbered data set, the median is the mean of the two values in the middle, so you simply divide
your data set into two halves.
__, __, __, __, __, __, __, __, __, __.
Step 3: Find Q1 and Q3.
Q1 is the median of the first half and Q3 is the median of the second half. Since each of these halves have an
odd number of values, there is only one value in the middle of each half.
__, __, __, __, __, __, __, __, __, __.
Step 4: Calculate the 𝐼𝑛𝑡𝑒𝑟𝑞𝑢𝑎𝑟𝑡𝑖𝑙𝑒 𝑅𝑎𝑛𝑔𝑒 = 𝑄3 − 𝑄1
Find the IQR with data an odd numbered data set:
81, 85, 64, 57, 72, 88, 77, 76, 52,
Step 1: Order your values from low to high.
Step 2: Locate the median, and then separate the values below it from the values above it.
In an odd-numbered data set, the median is the number in the middle of the list. The median itself is excluded
from both halves: one half contains all values below the median, and the other contains all the values above it
Step 3: Find Q1 and Q3. And then Step 4 calculate: 𝐼𝑛𝑡𝑒𝑟𝑞𝑢𝑎𝑟𝑡𝑖𝑙𝑒 𝑅𝑎𝑛𝑔𝑒 = 𝑄3 − 𝑄1
Year 11 General Unit 1 2025
Contents 3H Financial Applications using Geometric
Univariate Data ........................................... 3 Sequences and Recurrence Relations ......... 38
Measures of Centre and Spread .................... 3 4A The basics of a matrix ............................ 45
2A Classifying and Displaying Categorical 4B Adding and subtracting matrices ............ 47
Data ........................................................... 7 4C Scalar multiplication ............................ 48
2B Interpreting and Describing Frequency 4D Matrix multiplication ............................. 49
Tables and Bar Charts.................................. 8 4E Inverse matrices and simultaneous
2C Displaying and Describing Numerical Data equations using matrices ........................... 51
................................................................ 10 4E Solving simultaneous equations (Matrices)
2D Characteristics of Distributions, Dot Plots with Tech .................................................. 52
and Stem Plots .......................................... 11 4F Using matrices to model road and
Log10 Scale Histograms .............................. 12 communication networks .......................... 53
2H Boxplots .............................................. 14 4G Introduction to transition matrices ......... 56
2I Comparing the Distribution of a Numerical 4H Using recursion to answer questions that
Variable Across Groups ................................. 16 require multiple applications of a transition
2G Percentages of data lying within multiple matrix ...................................................... 57
standard deviations of the mean ................. 17 5A Substituting values into a formula .......... 61
Revision ................................................... 19 5B: Solving linear equations ....................... 62
Writing your answers ................................. 21 5D: Drawing straight-line graphs and finding
Rounding to Decimal Places and Significant their slope ................................................ 63
Figures ..................................................... 24 Positive and negative slopes of a straight line .. 63
We need way more finance applications 5E: Equations of straight lines..................... 65
questions throughout. Depreciation, cost per 5F: Finding the equation of a straight-line
use, reducing balance loans. ......................... 25 graph ....................................................... 66
1B Percentage increase and decrease Need a 5G: Linear modelling & Interpreting slope and
find a % question. Like find the % discount on a y-intercept ................................................ 71
special. $2 product down from 5$ .................. 25
5H: Solving simultaneous equations ........... 76
1C Goods and Services Tax (GST) ................... 26
Finding the point of intersection of two linear
Simple Interest ............................................. 27 graphs ......................................................... 76
Compound Interest....................................... 28 5J: Piecewise linear graphs ......................... 77
3A Number patterns...................................... 29
3B Recurrence Relations ............................... 30 Links
3C Introduction to Arithmetic Sequences ........ 31
Vicmathsnotes weebly VCAA GeneralMathematics
3D Arithmetic sequences using recursion ....... 32 Study Design Past VCAA Exams
3E Financial Applications using Arithmetic https://www.vcaa.vic.edu.au/assessment/vce/authoris
Sequences and Recurrence Relations ............ 33 ed-materials-and-equipment#01
3F Introduction to Geometric Sequences ........ 34
3G Recursion with Geometric Sequences .... 36
, 2
Data Formula Sheet Normal Distribution
Median
𝑛+1
th result. Q2. 50% of the data is less than this value.
2
Median is less affected by outliers.
Mean
Mean is affected by outliers or skewed data. 𝑥̅
Range
The range (R) is Largest – smallest value.
Range is affected by outliers.
Interquartile Range
The interquartile range (IQR) gives the spread of the
middle 50% of data values in an ordered data set.
IQR=Q3−Q1 IQR is less affected by outliers. 𝑥 − 𝑥̅
z= 𝒙 = 𝒙̅ + 𝒛 × 𝒔
Box Plots and Fences 𝑠𝑥
The whisker finishes on the highest or smallest value that Skewness and Choosing
is within the upper and lower fences. If there’s outliers or skews, choose IQR/ Median.
LF: Q1−1.5×IQR. UF: Q3+1.5×IQR. Which was is the data stretched?
5-Fig Summary
𝑚𝑖𝑛, 𝑄1, 𝑀𝑒𝑑𝑖𝑎𝑛, 𝑄3, 𝑀𝑎𝑥
Types of Data
Logs
𝑆𝑐𝑎𝑙𝑒𝑑 = 𝐿𝑜𝑔10 (𝐴𝑐𝑡𝑢𝑎𝑙) <=> 10𝑆𝑐𝑎𝑙𝑒𝑑 = 𝐴𝑐𝑡𝑢𝑎𝑙
Data 0.01 0.1 1 10 100 1000
If the mean makes sense then numerical. If not Log
log10 (0.01) log10(0.1) log10 (1) log10 (10) log10 (100) log10(1000)
categorical. Known Categorical data sets are student Form
Log
number 1,2,3,4,5, postcodes 3911,3893, 3906,… scale
-2 -1 0 1 2 3
Response Explanatory Graph
Segmented bar chart
Categorical Categorical Parallel bar chart
Two-way freq.
Numerical Categorical Parallel box/dot plot
Only two Back-to-back stem plot
Numerical
categories Parallel box/dot plot
Numerical Numerical Scatterplot
, 3
Univariate Data
Measures of Centre and Spread
Mean 𝑥̅ : The mean (average) is calculated by adding up all values (∑x) and dividing by the number of values (n).
It’s preferable when data has no extreme outliers, as it can be easily affected by very high or low numbers.
∑𝑥
𝑥̅ = 𝑛
𝑛+1
Median (Q2): The median is the "middle" value in an ordered data set, located in the th position. If n is odd,
2
the median is the middle data value. If n is even, it is the mean of the two middle values. The median is a better
choice for skewed data or data with outliers, as it is not influenced by extreme values.
Mode: The mode is the value that appears most frequently in a data set. It’s most useful for categorical data or
when identifying the most common value in a set.
Find the mean, median and mode for the number of hours worked by 17-year-olds over the summer break per
week as shown in the dot plot.
Which measure of centre best represents the number of hours worked by the group?
A measure of spread is calculated to judge the variability of a data set. That is, are most of the values
clustered together, or are they spread out? Measures or spread include Range, IQR and standard deviation.
Range (R): the range is affected by outliers. 𝑅 = 𝑀𝑎𝑥 − 𝑚𝑖𝑛.
Find the range of the marks from Task A
Notice that we have 2 extreme values here. Is the range affected by these values?
, 4
Interquartile Range IQR
Another measure of spread is needed, one which is not so influenced by extreme values. In the case of any
outliers, we prefer to use IQR. The statistic we use for this task is the interquartile range. Find the IQR with
data an even numbered data set:
81, 85, 64, 57, 48, 72, 88, 77, 76, 52
Step 1: Order your values from low to high.
__, __, __, __, __, __, __, __, __, __.
Step 2: Locate the median, and then separate the values below it from the values above it.
With an even-numbered data set, the median is the mean of the two values in the middle, so you simply divide
your data set into two halves.
__, __, __, __, __, __, __, __, __, __.
Step 3: Find Q1 and Q3.
Q1 is the median of the first half and Q3 is the median of the second half. Since each of these halves have an
odd number of values, there is only one value in the middle of each half.
__, __, __, __, __, __, __, __, __, __.
Step 4: Calculate the 𝐼𝑛𝑡𝑒𝑟𝑞𝑢𝑎𝑟𝑡𝑖𝑙𝑒 𝑅𝑎𝑛𝑔𝑒 = 𝑄3 − 𝑄1
Find the IQR with data an odd numbered data set:
81, 85, 64, 57, 72, 88, 77, 76, 52,
Step 1: Order your values from low to high.
Step 2: Locate the median, and then separate the values below it from the values above it.
In an odd-numbered data set, the median is the number in the middle of the list. The median itself is excluded
from both halves: one half contains all values below the median, and the other contains all the values above it
Step 3: Find Q1 and Q3. And then Step 4 calculate: 𝐼𝑛𝑡𝑒𝑟𝑞𝑢𝑎𝑟𝑡𝑖𝑙𝑒 𝑅𝑎𝑛𝑔𝑒 = 𝑄3 − 𝑄1

