

UC BERKLEY BIO 1AL 2026 ALL WEEKS(WEEK 1-10 )
COMPREHENSIVE
FOR MORE EXAMS BANK WITH 100% ACCURATE SOLUTIONS
EMAIL:
Last Name ____Ellis_______ First Name ____Mahiya _________ Lab Section #____223______
Lab 1 Post-Lab
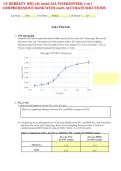
1) PAV data graph
Graph the PAV taste receptor data from the Bufe data Excel file on the Lab 1 home page. Refer to the
directions in the Lab 1 Procedures (in lab procedures reader). See videos on the Excel Graphing
Resources page in bCourses. Save the graph in Excel as an image (Ctrl Click on the graph > Save as
Picture or take a screenshot) and paste the image below. (1.5 pts)
2) EC50 t-test
a) State the null hypothesis for the EC50 t-test. (0.5 pts)
There is no significant difference between PTC and PROP in respect to EC50
b) Calculate the mean and standard error of the mean (SEM) for the PTC and PROP EC50 data in the Bufe
data Excel file on the Lab 1 home page. Refer to Excel Graphing Resources Video 1 for how to
calculate mean and SEM. Input the values in Table 1 below. (1 pt, 0.25 pts each)
Table 1. Comparison of EC50 for PTC vs. PROP for PAV variant of TAS2R38 receptor
EC50 for PTC EC50 for PROP
for PAV variant for PAV variant
Mean EC50 1.14 2.14
SEM 0.53 0.87
FOR MORE EXAMS
EMAIL:
,FOR MORE EXAMS
EMAIL:
Run an Independent Sample t-test using VassarStats, and record the
c)
relevant values below. See the
Comparing Two Means page in bCourses for guidance on performing and
interpreting the t-test. (1 pt)
t = __-0.989__ , df = ___12____ , p (2-tailed) =
__0.346431___
d) Based on the t-test results, is there a significant difference between the
mean EC 50 value for PTC vs. PROP? Which value (t, df or p) indicates
whether or not the difference is statistically significant? (0.5
pt)
Significant difference? Value indicating significance
(Circle/highlight) (Circle/highlight)
YES NO t df p value
e) Based on the t-test results, what should you do with the null
hypothesis? (select one) (0.5 pts)
Reject the null hypothesis Fail to reject the null
hypothesis
3) Chi squared test (Refer to the Chi squared test page in bCourses)
a) State the null hypothesis for the Chi squared test for PTC
taste intensity. (0.5 pt) The PAV variant and AVI variant
are independent of eachother.
FOR MORE EXAMS
EMAIL:
,FOR MORE EXAMS
EMAIL:
b) Complete the contingency table in the PTC intensity tab of the
Bufe data Excel file. Remember not to round numbers. Use
formulas in Excel to calculate the totals and proportions. Paste a
screenshot of your contingency table below. (0.5 pt)
c) Complete the Chi squared calculation table and paste a screenshot of it below. (1 pt)
d) Circle/highlight the p value range for your calculated Chi squared
value. Refer to the Chi Squared
Distribution Table (Table 2) on the
next page. (0.25 pt) p > 0.100
0.050 < p < 0.100 0.025 < p < 0.050
0.010 < p < 0.025 0.005 < p < 0.010
0.001 < p <
0.005 p <
0.001
e) Based on the results from the Chi squared test, what should you do
with the null hypothesis? (0.25 pts)
FOR MORE EXAMS
EMAIL:
, FOR MORE EXAMS
EMAIL:
Reject the null hypothesis Fail to reject the null hypothesis
f) What can you infer about the association between the TAS2R38
receptor variant and PTC taste perception? (0.25 pt)
We can infer that they are infact dependent of eachother
Table 2. Chi Squared Distribution Table
FOR MORE EXAMS
EMAIL:
COMPREHENSIVE
FOR MORE EXAMS BANK WITH 100% ACCURATE SOLUTIONS
EMAIL:
Last Name ____Ellis_______ First Name ____Mahiya _________ Lab Section #____223______
Lab 1 Post-Lab
1) PAV data graph
Graph the PAV taste receptor data from the Bufe data Excel file on the Lab 1 home page. Refer to the
directions in the Lab 1 Procedures (in lab procedures reader). See videos on the Excel Graphing
Resources page in bCourses. Save the graph in Excel as an image (Ctrl Click on the graph > Save as
Picture or take a screenshot) and paste the image below. (1.5 pts)
2) EC50 t-test
a) State the null hypothesis for the EC50 t-test. (0.5 pts)
There is no significant difference between PTC and PROP in respect to EC50
b) Calculate the mean and standard error of the mean (SEM) for the PTC and PROP EC50 data in the Bufe
data Excel file on the Lab 1 home page. Refer to Excel Graphing Resources Video 1 for how to
calculate mean and SEM. Input the values in Table 1 below. (1 pt, 0.25 pts each)
Table 1. Comparison of EC50 for PTC vs. PROP for PAV variant of TAS2R38 receptor
EC50 for PTC EC50 for PROP
for PAV variant for PAV variant
Mean EC50 1.14 2.14
SEM 0.53 0.87
FOR MORE EXAMS
EMAIL:
,FOR MORE EXAMS
EMAIL:
Run an Independent Sample t-test using VassarStats, and record the
c)
relevant values below. See the
Comparing Two Means page in bCourses for guidance on performing and
interpreting the t-test. (1 pt)
t = __-0.989__ , df = ___12____ , p (2-tailed) =
__0.346431___
d) Based on the t-test results, is there a significant difference between the
mean EC 50 value for PTC vs. PROP? Which value (t, df or p) indicates
whether or not the difference is statistically significant? (0.5
pt)
Significant difference? Value indicating significance
(Circle/highlight) (Circle/highlight)
YES NO t df p value
e) Based on the t-test results, what should you do with the null
hypothesis? (select one) (0.5 pts)
Reject the null hypothesis Fail to reject the null
hypothesis
3) Chi squared test (Refer to the Chi squared test page in bCourses)
a) State the null hypothesis for the Chi squared test for PTC
taste intensity. (0.5 pt) The PAV variant and AVI variant
are independent of eachother.
FOR MORE EXAMS
EMAIL:
,FOR MORE EXAMS
EMAIL:
b) Complete the contingency table in the PTC intensity tab of the
Bufe data Excel file. Remember not to round numbers. Use
formulas in Excel to calculate the totals and proportions. Paste a
screenshot of your contingency table below. (0.5 pt)
c) Complete the Chi squared calculation table and paste a screenshot of it below. (1 pt)
d) Circle/highlight the p value range for your calculated Chi squared
value. Refer to the Chi Squared
Distribution Table (Table 2) on the
next page. (0.25 pt) p > 0.100
0.050 < p < 0.100 0.025 < p < 0.050
0.010 < p < 0.025 0.005 < p < 0.010
0.001 < p <
0.005 p <
0.001
e) Based on the results from the Chi squared test, what should you do
with the null hypothesis? (0.25 pts)
FOR MORE EXAMS
EMAIL:
, FOR MORE EXAMS
EMAIL:
Reject the null hypothesis Fail to reject the null hypothesis
f) What can you infer about the association between the TAS2R38
receptor variant and PTC taste perception? (0.25 pt)
We can infer that they are infact dependent of eachother
Table 2. Chi Squared Distribution Table
FOR MORE EXAMS
EMAIL:

