A-level
GEOGRAPHY
Paper 1 Physical geography
Insert
This insert contains:
Figure 1 for use with Question 1
Figure 2 for use with Question 1
Figure 3 for use with Question 2
Figure 4 for use with Question 2
Figure 5 for use with Question 3
Figure 6 for use with Question 3
Figure 7 for use with Question 4
Figure 8 for use with Question 4
Figure 9 for use with Question 5
Figure 10 for use with Question 5
Figure 11 for use with Question 6
Figure 12 for use with Question 6.
AQA A-level GEOGRAPHY Paper 1 Physical geography Insert 2025
for more:
G/KL/Jun25/G4006/
E8
tyrionp
7 0 3 7/
ape rs. com
,1
, 2
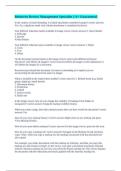
Figure 1
The projected cumulative changes in greenhouse gas emissions by selected countries
and groups of countries from 2015 to 2030
MtCO2e
0
– 500
– 1000
–
1500
Turkey (no change)
–
2000
– 2500
– 3000
– 3500
– 4000
– 4500
– 5000
Mexic
Argentin
a
a
Canada
a
Arabia
o Republic of
Korea Russian
South
Australi
Indi
Indonesi
Saudi
China
a
Japan
Federation
EU
for more:
G/ tyrionpapers.com
Jun25/7037/1
GEOGRAPHY
Paper 1 Physical geography
Insert
This insert contains:
Figure 1 for use with Question 1
Figure 2 for use with Question 1
Figure 3 for use with Question 2
Figure 4 for use with Question 2
Figure 5 for use with Question 3
Figure 6 for use with Question 3
Figure 7 for use with Question 4
Figure 8 for use with Question 4
Figure 9 for use with Question 5
Figure 10 for use with Question 5
Figure 11 for use with Question 6
Figure 12 for use with Question 6.
AQA A-level GEOGRAPHY Paper 1 Physical geography Insert 2025
for more:
G/KL/Jun25/G4006/
E8
tyrionp
7 0 3 7/
ape rs. com
,1
, 2
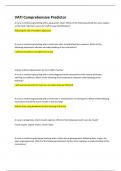
Figure 1
The projected cumulative changes in greenhouse gas emissions by selected countries
and groups of countries from 2015 to 2030
MtCO2e
0
– 500
– 1000
–
1500
Turkey (no change)
–
2000
– 2500
– 3000
– 3500
– 4000
– 4500
– 5000
Mexic
Argentin
a
a
Canada
a
Arabia
o Republic of
Korea Russian
South
Australi
Indi
Indonesi
Saudi
China
a
Japan
Federation
EU
for more:
G/ tyrionpapers.com
Jun25/7037/1