STAT 200 ELEMENTARY STATISTICS
Pennsylvania State University - All Campuses
Alle 22 resultaten
Sorteer op

-
STA 200- COURSE ASSGN.TESTS &EXAMS-2021 BUNDLE
- Voordeelbundel • 10 items • 2021
- $40.99
- + meer info
STAT200 - Assignment 2 Descriptive Statistics Data Analysis Plan.|SOLVED| STAT200 - Assignment 1 Descriptive Statistics Data Analysis Plan|SOLVED| STAT 200 ELEMENTARY STATISTICS-Week 2 Homework.|SOLVED|-2021 STAT 200 ELEMENTARY STATISTICS-Week 2 Homework Problems|SOLVED| STAT 200 ELEMENTARY STATISTICS-Midterm Exam - 2021.|ANSWERED| STAT 200 ELEMENT
-
STA 200- COURSE ASSGN.TESTS &EXAMS-2021 BUNDLE 2
- Voordeelbundel • 10 items • 2021
- $41.49
- + meer info
STAT200 - Assignment 2 Descriptive Statistics Data Analysis Plan.|SOLVED| STAT200 - Assignment 1 Descriptive Statistics Data Analysis Plan|SOLVED| STAT 200 ELEMENTARY STATISTICS-Week 2 Homework.|SOLVED|-2021 STAT 200 ELEMENTARY STATISTICS-Week 2 Homework Problems|SOLVED| STAT 200 ELEMENTARY STATISTICS-Midterm Exam - 2021.|ANSWERED| STAT 200 ELEMENT
-
STAT200 - Assignment 2 Descriptive Statistics Data Analysis Plan.|SOLVED|
- Tentamen (uitwerkingen) • 6 pagina's • 2021
- $9.49
- + meer info
STAT200 - Assignment 2 Descriptive Statistics Data Analysis Plan.|SOLVED|
-
STAT200 - Assignment 1 Descriptive Statistics Data Analysis Plan|SOLVED|
- Tentamen (uitwerkingen) • 4 pagina's • 2021
- $9.49
- + meer info
STAT200 - Assignment 1 Descriptive Statistics Data Analysis Plan|SOLVED| Scenario: I am a married 36 year old (Head of House hold) with one child. I earn an annual income of 100,097.00 USD. I have an annual expenditure of 17,808.00 USD; 12,408.00 USD is spend on mortgage; 3,600.00 USD on grocery shopping; 1,800.00 USD on fuel cost. I want to determine the annual expenditure of my household based off these base number. These number do not include eating out, cable/internet, electricity, water,...

Teveel maand over aan het eind van je geld?

-
STAT 200 ELEMENTARY STATISTICS-Week 2 Homework.|SOLVED|-2021
- Tentamen (uitwerkingen) • 5 pagina's • 2021
- $8.99
- + meer info
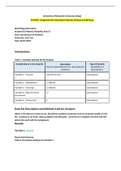
STAT 200 ELEMENTARY STATISTICS-Week 2 Homework.|SOLVED|-2021 2.2.13 Students in a statistics class took their first test. The following are the scores they earned. Create a frequency distribution and histogram for the data using classlimitsthat make sense for grade data. Describe the shape of the distribution.2.3.3 When an anthropologist finds skeletal remains, they need to figure out the height of the person. The height of a person (in cm) and the length of one of their metacarpal bone (in c...

-
STAT 200 ELEMENTARY STATISTICS-Week 2 Homework Problems|SOLVED|
- Tentamen (uitwerkingen) • 8 pagina's • 2021
- $9.49
- + meer info
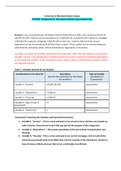
STAT 200 ELEMENTARY STATISTICS-Week 2 Homework Problems|SOLVED| The median incomes of females in each state of the United States, including the District of Columbia and Puerto Rico, are given in table #2.2.10 ("Median income of," 2013). Create a frequency distribution, relative frequency distribution, and cumulative frequency distribution using 7 classes. Step 1: 60,332 - 22,117= 38,215 Step 2: 7 Classes Step 3: 38,215 / 7 = 5,460 Step 4: Class 1 plus 5,460 Class 1 Class 2 Class 3 Class 4 C...
-
STAT 200 ELEMENTARY STATISTICS-Week 2 Homework Problems|SOLVED|
- Tentamen (uitwerkingen) • 8 pagina's • 2021
- $9.49
- + meer info
STAT 200 ELEMENTARY STATISTICS-Week 2 Homework Problems|SOLVED| The median incomes of females in each state of the United States, including the District of Columbia and Puerto Rico, are given in table #2.2.10 ("Median income of," 2013). Create a frequency distribution, relative frequency distribution, and cumulative frequency distribution using 7 classes. Step 1: 60,332 - 22,117= 38,215 Step 2: 7 Classes Step 3: 38,215 / 7 = 5,460 Step 4: Class 1 plus 5,460 Class 1 Class 2 Class 3 Class 4 C...
-
STAT 200 ELEMENTARY STATISTICS-LAB 10
- Tentamen (uitwerkingen) • 7 pagina's • 2021
- $9.49
- + meer info
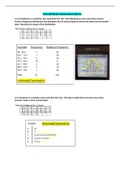
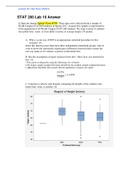
STAT 200 ELEMENTARY STATISTICS-LAB 10 1. Open the dataset Spring17Data.MTW. These data were collected from a sample of World Campus STAT200 students in Spring 2017. Assume this sample is representative of the population of all World Campus STAT 200 students. We want to know if students who prefer beer, water, or wine differ in terms of average height. [70 points] A. Why is a one-way ANOVA an appropriate statistical procedure for this scenario? (4) Since this data has more than more three inde...
-
STAT 200 ELEMENTARY STATISTICS-LAB 7.
- Tentamen (uitwerkingen) • 6 pagina's • 2021
- $10.49
- + meer info
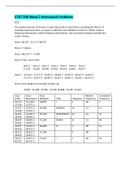
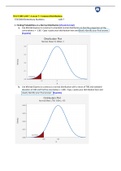
STAT 200 ELEMENTARY STATISTICS-LAB 7. 1 Finding Probabilities on a Normal Distribution [25 points total] a. Use Minitab Express to construct a standard normal distribution to find the proportion of the curve below z = -1.80. Copy + paste your distribution here and clearly identify your final answer.Use Minitab Express to construct a normal distribution with a mean of 780 and standard deviation of 100 and find the area below x = 600. Copy + paste your distribution here and clearly identify you...
