Correlation Study guides, Class notes & Summaries
Looking for the best study guides, study notes and summaries about Correlation? On this page you'll find 12775 study documents about Correlation.
Page 3 out of 12.775 results
Sort by
-
Test Bank for Clinical Chemistry Principles Techniques Correlations 9th Edition by Michael L. Bishop
- Exam (elaborations) • 125 pages • 2024
-
- $19.99
- 1x sold
- + learn more
Description: - In the file you can find extensive number of exam questions. - Supports different editions - Different difficulty levels ranging from easy to extremely difficult - The whole book is covered (All chapters) - Questions you can expect to see: Multiple choice questions, Problem solving, essays, Fill in the blanks, and True/False. - PDF Format *** If you have any questions or special request feel free to send a private message
RelativityOne Certified Pro sample Exam Questions With 100% Correct Answers!!
-
TEST BANK for Clinical Chemistry Principles, Techniques, and Correlations 9th Edition by Michael L. Bishop, Edward P. Fody, All Chapters 1 - 31, Complete Newest Version
- Exam (elaborations) • 126 pages • 2023
-
- $14.99
- 1x sold
- + learn more
TEST BANK for Clinical Chemistry Principles, Techniques, and Correlations 9th Edition by Michael L. Bishop, Edward P. Fody, All Chapters 1 - 31, Complete Newest Version Clinical Chemistry Principles, Techniques, and Correlations 9th Edition by Michael L. Bishop, Edward P. Fody Clinical Chemistry Principles, Techniques, and Correlations 9th Edition TEST BANK for Clinical Chemistry Principles, Techniques, and Correlations 9th Edition by Michael L. Bishop, Edward P. Fody, All Chapters 1 -...
-
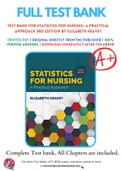
Test Bank For Statistics for Nursing: A Practical Approach 3rd Edition by Elizabeth Heavey 9781284142013 Chapter 1-13 Complete Guide .
- Exam (elaborations) • 82 pages • 2022
-
- $20.48
- 15x sold
- + learn more
Test Bank For Statistics for Nursing: A Practical Approach 3rd Edition by Elizabeth Heavey 2013, 9 , 4596, 4 1: Introduction to Statistics and Levels of Measurement 2: Presenting Data 3: Descriptive Statistics, Probability, and Measures of Central Tendency 4: Measuring Data 5: Sampling Methods 6: Generating the Research Idea 7: Sample Size, Effect Size, and Power 8: Chi-Square 2 × 2 Table 9: Student t-Test 10: Analysis of Variance (ANOVA) 11: Correlation Coe...
-
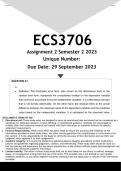
ECS3706 Assignment 2 (ANSWERS) Semester 2 2023 - DISTINCTION GUARANTEED.
- Exam (elaborations) • 10 pages • 2023
-
- $2.70
- 10x sold
- + learn more
Well-structured ECS3706 Assignment 2 (ANSWERS) Semester 2 2023 - DISTINCTION GUARANTEED.. (DETAILED ANSWERS - DISTINCTION GUARANTEED!). QUESTION A1 (15 marks) (a) One of the most challenging concepts to master in this module is distinguishing between the stochastic error term and the residual. List three differences between the stochastic error term and the residual (3) (b) Explain in detail how Ordinary Least Squares (OLS) works in estimating the coefficients of a linear regression model. (3)...
-
Post 301--Broker Relationships and Responsibilities Questions With 100% Correct Answers.
- Exam (elaborations) • 8 pages • 2023
-
- $8.49
- 1x sold
- + learn more
Material fact - About the property Related to the property Principal able to complete the transaction Special importance Disclosing material facts about a seller's property - To client or customer Even if it hurts your customer Regardless of how pubic the material fact is Listing agent has highest responsibility Buyer agent is responsible to disclose if known Answer questions to avoid misrepresentation Willful - intentional Negligent - Unintentional--failure to exercise reasonable c...

-
Business Relationship Manager Professional (BRMP) Certification Exams (Latest 2023/ 2024 UPDATES STUDY BUNDLE) Questions and Verified Answers- 100% Correct
- Package deal • 5 items • 2023
-
- $25.49
- 1x sold
- + learn more
Business Relationship Manager Professional (BRMP) Certification Exams (Latest 2023/ 2024 UPDATES STUDY BUNDLE) Questions and Verified Answers- 100% Correct
-
IOP2601 Assignment 2 (QUALITY ANSWERS) Semester 1 2024
- Exam (elaborations) • 10 pages • 2024
-
- $2.70
- 5x sold
- + learn more
This document contains workings, explanations and solutions to the IOP2601 Assignment 2 (QUALITY ANSWERS) Semester 1 2024. For assistance call or us on 0.6.8..8.1.2..0.9.3.4...... QUESTION 1 [11] Use the information below to answer the questions that follow. “Employee of the Month” Selection A large corporation presents an annual "Employee of the Month" award, where the winner receives a bonus of R10 000 along with recognition and a certificate of appreciation. Two employees, Zodwa an...
-
CSM Leiden - SWOC/T Analysis for SAIC on DSI (Dienst Speciale Interventies)
- Case • 15 pages • 2023
-
Available in package deal
-
- $10.23
- 13x sold
- + learn more
Graded with a 7.5; additional feedback received in description of the document! The document encompasses an in depth internal and external analysis of the Dienst Speciale Interventies (DSI) of the Dutch National Police. This assignment was a part of the course Security: Actors, Institutions and Constellations of the Crisis and Security Management MSc. program. To give you an extra advantage for getting an even higher grade, I have added the feedback I received. Feedback: ''The paper examin...
Test Bank for Clinical Chemistry Principles Techniques Correlations 9th Edition by Michael L. Bishop

$6.50 for your textbook summary multiplied by 100 fellow students... Do the math: that's a lot of money! Don't be a thief of your own wallet and start uploading yours now. Discover all about earning on Stuvia

