Knowledge clip 1: Chapter 1 (Data and Statistics)
Statistics (also data science) = the art and science of collecting, analyzing, presenting and interpreting
data (the result from going from your hypothesis, to collecting data, to presenting your results).
Companies have really large datasets, with all kinds of data. Statistics is also about providing
information based on data to support decision-making. Main point:
➔ Example: an analyst of Zalando could run a project. What are the drivers of product returns?
What makes that certain products are returned more often than other products? Are there
certain customers returning more products than other customers? Maybe it’s related to
promotions. If you do a discount, maybe not only sales go up, but also returns go up.
Database/data set = collection of all the data that is relevant for a certain topic (in SPSS/Excel). Most
databases have the same structure, often shown as a data matrix consisting:
• Columns → variables
• Rows → observations, elements, cases, subjects
• Each cell → measurement, data point
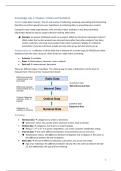
There are different types of variables. The classical way to make a distinction is at the level of
measurement. There are four measurement levels:
Toelichting:
• Nominal data → categories (no order or direction).
➔ Someone’s name, the country where someone is from, male or female.
• Ordinal data → categories, but there’s an order/ranking.
➔ Being 1st, 2nd or 3rd in a sports competition, 1 to 5 stars customer satisfaction rating.
• Interval data → the same differences between measurements, but no true zero.
➔ Temperature Celsius: the difference between 10 degrees and 11 degrees is the same as
the difference between 40 and 41 degrees.
• Ratio data → the same difference between scale points, but a true zero exists.
➔ Age of an individual: the difference between 18 and 19 is the same as between 50 and
51, but additionally, the age of 0 has meaning.
1
,The level measurement has major consequences for what you can do statistically/mathematically
with your data/variables. From nominal to ratio: data becomes more powerful, less restrictive.
There are three different types of datasets:
• Cross-sectional data → survey of cases, all measured at one period of time.
➔ Survey conducted among customers
• Time-series data (more common in finance) → variables measured over time.
➔ Various stock prices
• Panel data → combination: multiple cases, same variables measured at multiple time points.
➔ Consumer panel reporting purchase behavior (every year, you send the same survey to
your customers and measure the same things over and over again).
➔ If you do a price discount in a supermarket and you have additional sales, but you don’t
have panel data, you can’t see if it’s more people buying your products or the same
people buying more of your products. You need individual data (who is buying what over
time) to see whether you have the same customers or you attracted new customers.
There are different types of data in terms of data sources:
• Primary data → collecting new data
• Secondary data → using existing data
2
, Statistics is a way to get information from data:
Key statistical concepts:
• Population → the group of all items/cases of interest. One wants to draw a conclusion on
this group.
• Sample → the group of items/cases drawn from the population (sub-group; the group that
you study). One applies statistical analysis on the data from a sample.
3
Statistics (also data science) = the art and science of collecting, analyzing, presenting and interpreting
data (the result from going from your hypothesis, to collecting data, to presenting your results).
Companies have really large datasets, with all kinds of data. Statistics is also about providing
information based on data to support decision-making. Main point:
➔ Example: an analyst of Zalando could run a project. What are the drivers of product returns?
What makes that certain products are returned more often than other products? Are there
certain customers returning more products than other customers? Maybe it’s related to
promotions. If you do a discount, maybe not only sales go up, but also returns go up.
Database/data set = collection of all the data that is relevant for a certain topic (in SPSS/Excel). Most
databases have the same structure, often shown as a data matrix consisting:
• Columns → variables
• Rows → observations, elements, cases, subjects
• Each cell → measurement, data point
There are different types of variables. The classical way to make a distinction is at the level of
measurement. There are four measurement levels:
Toelichting:
• Nominal data → categories (no order or direction).
➔ Someone’s name, the country where someone is from, male or female.
• Ordinal data → categories, but there’s an order/ranking.
➔ Being 1st, 2nd or 3rd in a sports competition, 1 to 5 stars customer satisfaction rating.
• Interval data → the same differences between measurements, but no true zero.
➔ Temperature Celsius: the difference between 10 degrees and 11 degrees is the same as
the difference between 40 and 41 degrees.
• Ratio data → the same difference between scale points, but a true zero exists.
➔ Age of an individual: the difference between 18 and 19 is the same as between 50 and
51, but additionally, the age of 0 has meaning.
1
,The level measurement has major consequences for what you can do statistically/mathematically
with your data/variables. From nominal to ratio: data becomes more powerful, less restrictive.
There are three different types of datasets:
• Cross-sectional data → survey of cases, all measured at one period of time.
➔ Survey conducted among customers
• Time-series data (more common in finance) → variables measured over time.
➔ Various stock prices
• Panel data → combination: multiple cases, same variables measured at multiple time points.
➔ Consumer panel reporting purchase behavior (every year, you send the same survey to
your customers and measure the same things over and over again).
➔ If you do a price discount in a supermarket and you have additional sales, but you don’t
have panel data, you can’t see if it’s more people buying your products or the same
people buying more of your products. You need individual data (who is buying what over
time) to see whether you have the same customers or you attracted new customers.
There are different types of data in terms of data sources:
• Primary data → collecting new data
• Secondary data → using existing data
2
, Statistics is a way to get information from data:
Key statistical concepts:
• Population → the group of all items/cases of interest. One wants to draw a conclusion on
this group.
• Sample → the group of items/cases drawn from the population (sub-group; the group that
you study). One applies statistical analysis on the data from a sample.
3