Intermediate macroeconomics: Growth and
Sustainability
Week 1
GDP = value of the output produced in a country = total income (wages + rents + interests +
profits). It is a good measure of a country’s well-being but isn’t perfect.
Purchasing power parity PPP is used to compare a country’s GDPs, although they have
different currencies.
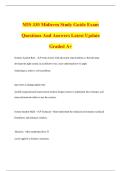
The 80% of countries with the lowest GDP per capita are close together, but the richest 20%
are extremely wealthy, receiving 60% of world income.
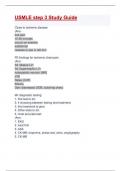
After WWII, the average rate of growth of world income increased. But not all countries
experienced large growth, so nowadays between-country inequality is more important than
within-country inequality.
Different factors, such as savings and investments influence GDP. Other factors that may
influence GDP between countries are the following:
Capital: the tools that workers have, such as machines.
Productivity: the amount of output produced with each unit of capital.
Technology: the available knowledge about how inputs can be combined to produce
output.
Efficiency: how the available technology and inputs into production are used in
producing output.
Productivity = technology * efficiency.
There is more input than capital. All types of inputs are factors of production.
Proximate cause: an event immediately responsible for causing some observed result.
Ultimate cause: the event affects an observed result through a chain of intermediate events.
Outliers: in a scatter plot, some variables which are inconsistent with the overall relationship.
Correlation coefficient: a number between -1 and 1, 1 indicating perfect positive correlation,
-1 indicating perfect negative correlation. Correlation between X and Y can be caused by:
X causes Y. On a scatter plot, you should put X on the x-axis, and Y on the y-axis.
Y causes X, while thinking X causes Y (=reverse causation).
There is no direct relationship between X and Y, but variable Z (=omitted variable)
causes both X and Y.
If two countries have the same fundamentals, the one with lower GDP will experience higher
growth in the shortrun, as a similar level of GDP is expected in the longrun.
Week 2
Capital is all tools: machines, buildings, infrastructure, vehicles, and computers. More and
better capital often leads to more output, so countries with higher levels of capital, often
have higher GDP. Capital has five characteristics:
It is productive it raises the output a worker can produce.
, It is produced it has been built or created (= investment).
It is limited/rival only a limited number of people can use a given piece of capital
at one time.
It can earn a return selling capital gives a return, and using capital leads to higher
wages.
It wears out = depreciation using capital usually causes it to wear down a little,
even if there is no damage (in this case because of the passage of time).
Production function: Y = F(K,L)
Y: quantity of output
K: capital
L: labor
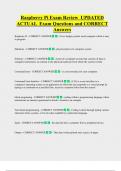
This function assumes constant returns to scale and diminishing marginal product, which is
the extra output produced when one more unit of the input is used.
You can multiply both sides of the equation by 1/L to calculate it per worker: y = F(k,1).
y = output per worker = Y/L
k = quantity of capital per worker = K/L.
MPK = marginal product of capital = f(k+1) – f(k).
Cobb-Douglas production function: F(K,L) = AKaL1-a, with A measuring productivity, and a
having a value between 0 and 1, determining how capital and labor combine to produce
output. Per-worker we get y = Aka.
MPK = aAKa-1L1-a.
The capital’s share of income is the fraction of the national income Y that is paid out as rent
on capital = (MPK * K) / Y = (aAKaL1-a) / (AKaL1-a) = a. The same way is for labor, which leads to
a labor’s share of 1-a. a normally is somewhere around 1/3.
The optimal quantity of labor is where MPL equals the wage.
In the Solow model, we assume a constant A, so all change comes from the accumulation of
capital, which is driven by investment I and depreciation D.
DeltaK = I – D.
Per worker: deltak = i – d.
Assume gamma is a constant fraction of output that is invested. Per-worker: i = gamma*y.
Assume delta (noncapital) is a constant fraction of the capital stock that is depreciated each
period: d = delta * k.
Using the new formulas, we get per worker: deltak = gamma * y – delta * k
= yf(k) – delta * k = gamma * Aka – delta * k.
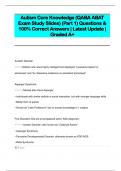
kss = the steady state = the level of capital at which depreciation equals investment, meaning
the amount of capital per worker will not change over time. kss and yss are positively
correlated.
Over time, capital stock will move toward the steady state (=convergence toward the steady
state). It could be not near its steady state after a war, or after a change in the investment
rate. If countries have the same rate of investment but different levels of income, the country
Sustainability
Week 1
GDP = value of the output produced in a country = total income (wages + rents + interests +
profits). It is a good measure of a country’s well-being but isn’t perfect.
Purchasing power parity PPP is used to compare a country’s GDPs, although they have
different currencies.
The 80% of countries with the lowest GDP per capita are close together, but the richest 20%
are extremely wealthy, receiving 60% of world income.
After WWII, the average rate of growth of world income increased. But not all countries
experienced large growth, so nowadays between-country inequality is more important than
within-country inequality.
Different factors, such as savings and investments influence GDP. Other factors that may
influence GDP between countries are the following:
Capital: the tools that workers have, such as machines.
Productivity: the amount of output produced with each unit of capital.
Technology: the available knowledge about how inputs can be combined to produce
output.
Efficiency: how the available technology and inputs into production are used in
producing output.
Productivity = technology * efficiency.
There is more input than capital. All types of inputs are factors of production.
Proximate cause: an event immediately responsible for causing some observed result.
Ultimate cause: the event affects an observed result through a chain of intermediate events.
Outliers: in a scatter plot, some variables which are inconsistent with the overall relationship.
Correlation coefficient: a number between -1 and 1, 1 indicating perfect positive correlation,
-1 indicating perfect negative correlation. Correlation between X and Y can be caused by:
X causes Y. On a scatter plot, you should put X on the x-axis, and Y on the y-axis.
Y causes X, while thinking X causes Y (=reverse causation).
There is no direct relationship between X and Y, but variable Z (=omitted variable)
causes both X and Y.
If two countries have the same fundamentals, the one with lower GDP will experience higher
growth in the shortrun, as a similar level of GDP is expected in the longrun.
Week 2
Capital is all tools: machines, buildings, infrastructure, vehicles, and computers. More and
better capital often leads to more output, so countries with higher levels of capital, often
have higher GDP. Capital has five characteristics:
It is productive it raises the output a worker can produce.
, It is produced it has been built or created (= investment).
It is limited/rival only a limited number of people can use a given piece of capital
at one time.
It can earn a return selling capital gives a return, and using capital leads to higher
wages.
It wears out = depreciation using capital usually causes it to wear down a little,
even if there is no damage (in this case because of the passage of time).
Production function: Y = F(K,L)
Y: quantity of output
K: capital
L: labor
This function assumes constant returns to scale and diminishing marginal product, which is
the extra output produced when one more unit of the input is used.
You can multiply both sides of the equation by 1/L to calculate it per worker: y = F(k,1).
y = output per worker = Y/L
k = quantity of capital per worker = K/L.
MPK = marginal product of capital = f(k+1) – f(k).
Cobb-Douglas production function: F(K,L) = AKaL1-a, with A measuring productivity, and a
having a value between 0 and 1, determining how capital and labor combine to produce
output. Per-worker we get y = Aka.
MPK = aAKa-1L1-a.
The capital’s share of income is the fraction of the national income Y that is paid out as rent
on capital = (MPK * K) / Y = (aAKaL1-a) / (AKaL1-a) = a. The same way is for labor, which leads to
a labor’s share of 1-a. a normally is somewhere around 1/3.
The optimal quantity of labor is where MPL equals the wage.
In the Solow model, we assume a constant A, so all change comes from the accumulation of
capital, which is driven by investment I and depreciation D.
DeltaK = I – D.
Per worker: deltak = i – d.
Assume gamma is a constant fraction of output that is invested. Per-worker: i = gamma*y.
Assume delta (noncapital) is a constant fraction of the capital stock that is depreciated each
period: d = delta * k.
Using the new formulas, we get per worker: deltak = gamma * y – delta * k
= yf(k) – delta * k = gamma * Aka – delta * k.
kss = the steady state = the level of capital at which depreciation equals investment, meaning
the amount of capital per worker will not change over time. kss and yss are positively
correlated.
Over time, capital stock will move toward the steady state (=convergence toward the steady
state). It could be not near its steady state after a war, or after a change in the investment
rate. If countries have the same rate of investment but different levels of income, the country