Wo r k ed ex a m p l e 1 :( H 3
I. Standardized scores:
The total number of correctanswers is transformed to a T-score which has mean 50 andSD 20.
Between which I-scores will approx. 95% the
of population scores lie?
In normal distribution, the lower bound is at -1.96 SDs /orappr.2 SDS) below the mean and the
upper bound is at1.96 SDS above the mean. Thus, the 95%CI lies between a T-score of
50 11.96 28) 50 11.96 * IM*SDnew
-
=
10.8
=
and
+
20) 89.2 (10
+ =
and 90) new
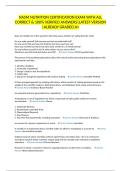
Describe the distribution ofscores:Descriptives -
Explore +
"correct scores" as dependent
skeweness and kurtosis values should be divided by their
·
SES, this value should be compared to -
2 and 2.
Ifthe value for skeweness is larger than 2:distribution
is
negatively skewed
↳ If
t he value for skeweness is larger than 2:distribution
is positively skewed
-
8,975 If kurtosis value greater than -
2:peak
o fdistribution is
1,569
+00 flate
greater than 2:Peakis too sharp
skeweness 1-8,975):slightly negatively skewed butnotsign.!
->
Kurtosis(1,69):peak is sharp butn ot significantly!
Kolmogorox-smirnox test:is significantK.001), indicating a deviation from a normal distr.
ibution! unsignificant:normal distribution
1K.S.- testis very conservative!
calculate
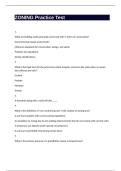
the z-scores and the T-scores:
The Z-score is a standard score with a mean of0 and SD of 1, which is calculated using Raw
scores, the mean of the raw scores and sp of the raw scores. The T-score is a converted
Standardized score, intended to have values thatppl find easier to understand.
The Escore is convertedinto a new standard score IT-score) by multiplying the E-score with
the SD ofthe new score (28) and adding the mean ofthe new score (50)
1) Analyze, Descriptive Statistics' Descriptives X Save standardized variables (E- scores)
2.) Transform, compute to variable T
calculate
T RND
=
120x2-20r 50) +
T- scores based on raw scores
2-scores wereonly standardized, notnormalized
, percentile
2.5,97.5
calculate
9 5% interval of the scores using percentile ranks
1.) Analyze' Descriptive Statistics Explore: T-variable in dependentl ist
statistics X percentiles, Paste
2)I n syntax, change: / Percentiles (5,10,25,50,75,90,95) HAVERAGE
intO
↑Percentile (2.5,97.5) HAVERAGE to gett h e lowest and highest2.5% percentiles
The answer differs from a) bc lower bound is 7 andupper is 92 (VS.10190)
because ata) we assumed a normal distribution, while we DON'T assume a normal distrib-
ution when we use percentiles.
percentile rankS
#
To make norm scores, one can use percentile ranks andp-values thatstem from the standard normal
distribution:
both percentile ranks and p-values indicate the yof ppl with an equal or lower score.
percentiles:calculated using all the raw scores wo
making assumption aboutdistribution ofthe scores
p-values:calculated using only mean and sp ofraw scores and
assuming a standard normal
IP-values:normality assumption
distribution
whether you use percentiles or p-values depends on whether you can assume a normal distribution in the
population or not
p-value preferred by it's less influenced by sample fluctuations
When no information known aboutpopulation and whether it's normally distributed, percentile ranks best to use
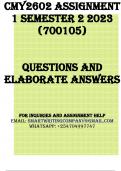
calculate p-value stemming from the standard normal distribution (z-scores):
1) Transform, compute to calculate percentile ranks using the standard normal distribution
CDF. NORMAL (Enr cor, 0,1
mean SD
CDF:cumulative distribution function;needed to calculate
the p-value for a certain z- score.
we know thata standardnormal distribution is a perfectly norm. dist. With mean 0 andSD1
calculate
percentives for the number corrects cores (raw scores
1) Transform, Rank cases Variables:h r cor ranktypes:X
fractional rankas
INTERPRETATION:
The percentile rank for a grade of 3.9 is 18.34 and p-value is 0,17
3
15.34% ofthe students hada grade of3.9 or lower.
don't differ a lot:so we can say the distribution
1
17%of the students had a grade of3.9 or lower.
t he
of
grades is fairly normal
use p-values when we can safely assume the distribution ofscores to be normal!
Ifnot:use smith that's not
assuming normal distribution (e..:percentile ranks)
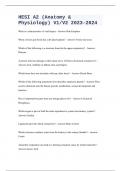
, .Normalized scores
#
normalized T-score has
A to be caculated: 50
Meannew= sDrew=20
O RMALIZATION:
M
1) compute directpercentile ranks Rank Cases
2) convert the percentile ranks into standard scores (Nar_20r)
where the actual normalization oft he scores takes place be the standard scores are now no
longer based on the raw scores (like z-scores), buton percentile ranks!
3) compute convertedstandard score with mean 50 and SD 20 +
ur -cor + 20 50
+
Difference btw F-Scores from I . andIII.:
·The T-scores and F-norm scores differ on same Grade (e.9.:Grace 6:61/63). They differ because
the T-scores were notn ormalized, they were only standardizedIZ-Scores). The T-norm scores were
both standardized and normalized. raw scores, z-scores transformation
·F scores:transformations oft he z-scores (Standardized, notnormalized) - use raw scores
Why Iscores have same distribution ofthe raw scores (thus notnecessarily norm all
·
F-norm scores:transformation t he
of normalized scores. perientile+ z-scures transformation
-
·Standard scores calculated based on assump. of a normal distribution
the course coordinator shouldprefer the normalized scores to be sure thatthe assumption of a
normal distribution ofthe scores is met.
I. Standardized scores:
The total number of correctanswers is transformed to a T-score which has mean 50 andSD 20.
Between which I-scores will approx. 95% the
of population scores lie?
In normal distribution, the lower bound is at -1.96 SDs /orappr.2 SDS) below the mean and the
upper bound is at1.96 SDS above the mean. Thus, the 95%CI lies between a T-score of
50 11.96 28) 50 11.96 * IM*SDnew
-
=
10.8
=
and
+
20) 89.2 (10
+ =
and 90) new
Describe the distribution ofscores:Descriptives -
Explore +
"correct scores" as dependent
skeweness and kurtosis values should be divided by their
·
SES, this value should be compared to -
2 and 2.
Ifthe value for skeweness is larger than 2:distribution
is
negatively skewed
↳ If
t he value for skeweness is larger than 2:distribution
is positively skewed
-
8,975 If kurtosis value greater than -
2:peak
o fdistribution is
1,569
+00 flate
greater than 2:Peakis too sharp
skeweness 1-8,975):slightly negatively skewed butnotsign.!
->
Kurtosis(1,69):peak is sharp butn ot significantly!
Kolmogorox-smirnox test:is significantK.001), indicating a deviation from a normal distr.
ibution! unsignificant:normal distribution
1K.S.- testis very conservative!
calculate
the z-scores and the T-scores:
The Z-score is a standard score with a mean of0 and SD of 1, which is calculated using Raw
scores, the mean of the raw scores and sp of the raw scores. The T-score is a converted
Standardized score, intended to have values thatppl find easier to understand.
The Escore is convertedinto a new standard score IT-score) by multiplying the E-score with
the SD ofthe new score (28) and adding the mean ofthe new score (50)
1) Analyze, Descriptive Statistics' Descriptives X Save standardized variables (E- scores)
2.) Transform, compute to variable T
calculate
T RND
=
120x2-20r 50) +
T- scores based on raw scores
2-scores wereonly standardized, notnormalized
, percentile
2.5,97.5
calculate
9 5% interval of the scores using percentile ranks
1.) Analyze' Descriptive Statistics Explore: T-variable in dependentl ist
statistics X percentiles, Paste
2)I n syntax, change: / Percentiles (5,10,25,50,75,90,95) HAVERAGE
intO
↑Percentile (2.5,97.5) HAVERAGE to gett h e lowest and highest2.5% percentiles
The answer differs from a) bc lower bound is 7 andupper is 92 (VS.10190)
because ata) we assumed a normal distribution, while we DON'T assume a normal distrib-
ution when we use percentiles.
percentile rankS
#
To make norm scores, one can use percentile ranks andp-values thatstem from the standard normal
distribution:
both percentile ranks and p-values indicate the yof ppl with an equal or lower score.
percentiles:calculated using all the raw scores wo
making assumption aboutdistribution ofthe scores
p-values:calculated using only mean and sp ofraw scores and
assuming a standard normal
IP-values:normality assumption
distribution
whether you use percentiles or p-values depends on whether you can assume a normal distribution in the
population or not
p-value preferred by it's less influenced by sample fluctuations
When no information known aboutpopulation and whether it's normally distributed, percentile ranks best to use
calculate p-value stemming from the standard normal distribution (z-scores):
1) Transform, compute to calculate percentile ranks using the standard normal distribution
CDF. NORMAL (Enr cor, 0,1
mean SD
CDF:cumulative distribution function;needed to calculate
the p-value for a certain z- score.
we know thata standardnormal distribution is a perfectly norm. dist. With mean 0 andSD1
calculate
percentives for the number corrects cores (raw scores
1) Transform, Rank cases Variables:h r cor ranktypes:X
fractional rankas
INTERPRETATION:
The percentile rank for a grade of 3.9 is 18.34 and p-value is 0,17
3
15.34% ofthe students hada grade of3.9 or lower.
don't differ a lot:so we can say the distribution
1
17%of the students had a grade of3.9 or lower.
t he
of
grades is fairly normal
use p-values when we can safely assume the distribution ofscores to be normal!
Ifnot:use smith that's not
assuming normal distribution (e..:percentile ranks)
, .Normalized scores
#
normalized T-score has
A to be caculated: 50
Meannew= sDrew=20
O RMALIZATION:
M
1) compute directpercentile ranks Rank Cases
2) convert the percentile ranks into standard scores (Nar_20r)
where the actual normalization oft he scores takes place be the standard scores are now no
longer based on the raw scores (like z-scores), buton percentile ranks!
3) compute convertedstandard score with mean 50 and SD 20 +
ur -cor + 20 50
+
Difference btw F-Scores from I . andIII.:
·The T-scores and F-norm scores differ on same Grade (e.9.:Grace 6:61/63). They differ because
the T-scores were notn ormalized, they were only standardizedIZ-Scores). The T-norm scores were
both standardized and normalized. raw scores, z-scores transformation
·F scores:transformations oft he z-scores (Standardized, notnormalized) - use raw scores
Why Iscores have same distribution ofthe raw scores (thus notnecessarily norm all
·
F-norm scores:transformation t he
of normalized scores. perientile+ z-scures transformation
-
·Standard scores calculated based on assump. of a normal distribution
the course coordinator shouldprefer the normalized scores to be sure thatthe assumption of a
normal distribution ofthe scores is met.