Page 2 sur 15 résultats
Trier par
-
Week 2
- Resume • 3 pages • 2023
- 9,97 €
- + en savoir plus
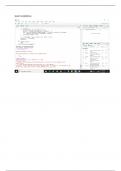
Following the instrutions in the book, install the sparklyr library and a Spark cluster on your local machine. The instructions in the book contemplate that you will be using Windows. If you are not running Windows, use a virtual machine. If you are using your employer's equipment, you may enounter a trusted domain error. This will also require that you install a virtual machine. The code in the book assumes Spark version 2.3 and Java 8. You are free to use any version, of course, but the co...
-
Week 6
- Resume • 3 pages • 2023
- 9,97 €
- + en savoir plus
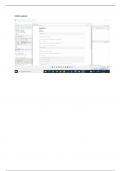
The text is Mastering Spark with R. Using the sc connection with Java 8, execute the following lines of code: >summarize(cars, mpg_percentile = percentile(mpg, 0.25) >summarize(cars, mpg_percentile = percentile(mpg, 0.25) %>% show_query() >summarize(cars, mpg_percentile = percentile(mpg, array(0.25, 0.5, 0.75) )) >summarize(cars, mpg_percentile = percentile(mpg, array(0.25, 0.5, 0.75) )) %>% mutate(mpg_percentile = explode(mpg_percentile))
-
Week 10
- Resume • 3 pages • 2023
- 9,97 €
- + en savoir plus
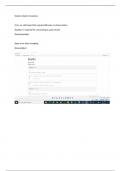
Follow the instructions in the book in Chapter 4 to read in the okc data. Explain what each element in the code is doing. Glimpse() the data. ANSWER THESE QUESTIONS; 1.What is the data type of the essay fields? 2.What do they contain? 3.How do you know the data is in Spark? Continue to use the code in Chapter 4 to add a response variable. ANSWER THESE QUESTIONS: 4. What is the response variable added? 5. Explain how the response variable is aggregated. 6. What is the tally? Continue t...
-
Week 3
- Resume • 2 pages • 2023
- 9,97 €
- + en savoir plus
The text is Mastering Spark with R. After installing the dplyr library, use the following code in R studio, create a scatter plot of hp v. mpg cars2 <- copy_to(sc, mtcars) cars3 <- (cars2) cars4 <- select(cars3, hp, mpg) cars5 <- sample_n(cars4, 32) cars6 <- collect(cars5) plot(cars6)
-
Week 1
- Resume • 1 pages • 2023
- 9,97 €
- + en savoir plus
Submit a Word or .pdf document with screen shots of R Studio where you have created a vector of three words. Whenever you are asked to submit a screenshot, include either a sliver of your desktop or a timestamp from your desktop. Always repeat the question you are answering.
