Full summary of the course
Advanced Data Analysis (theoretical
lessons)
geschreven door
Bi0med
www.stuvia.com
Gedownload door: cynthiavervoort | Wil jij €76 per
Dit document is auteursrechtelijk beschermd, het verspreiden van dit document is strafbaar. maand verdienen?
, Stuvia - Koop en Verkoop de Beste Samenvattingen
ADVANCED DATA ANALYSIS
CHAPTER 1: INTRODUCTION 18/02
1.1 BIG DATA
Data for which conventional computer techniques are not sufficient anymore due to size,
complexity.. It is a disruptive trend in computer sciences. Characterised by:
1. Volume 2. Velocity 3. Variety 4. Veracity
Fourth paradigm: for thousands of years we had experimental and observable science, later there
was theoretical science (Newton, formulas…). Then the raise of computer science occurred to
simulate things such as weather forecasts. Now new time of data-driven science where data is the
breeding ground of the science we are doing. You first look at what data is already out there: re-
analyse data.
1. DATA VOLUME
An unprecedented amount of information is coming towards us. For example genomics information
is huge, while the cost of sequencing genomes has gone down tremendously. Computer power is
roughly doubling every 18 months for the same price: faster computers, bigger hard drives. We have
to learn new ways to deal with this big amounts of data.
2. DATA VELOCITY
The speed at which data is generated and the speed at which we need to analyse it. If we sequence a
lot of genomes we can take our times to analyse the genomes and publish it, but some data (such as
sensors) need to be processed immediately.
Also transporting data is a bottleneck: takes too long. Often hard drives are transported, which is
more efficient than internet availability and fibers. Data can be sent from China to here by hard
drives instead of through the internet.
Dynamic molecules profiles can now also be sequenced and analysed, for example by sequencing the
immune system, which is changing constantly. This data is therefore preferably processed instantly,
to know the status of patients in real time.
3. DATA VARIETY
A lot of data in biomedical sciences is heterogenous and unstructured. Most data is based on
literature you need to read, also unstructured image data (just pixels). We estimate that 80% of the
world’s data is structured and also very diverse: DNA sequences, protein structures, gene regulation,
interactions, morphology, metabolism… This data is all heterogenous: difficult to deal with this much
diversity.
4. DATA VERACITY
= trustworthiness of data. There is a lot of uncertainty about data points. This uncertainty is not
consistent: you can’t make a standard deviation of every data point in big data because the
Gedownload door: cynthiavervoort | Wil jij €76 per
Dit document is auteursrechtelijk beschermd, het verspreiden van dit document is strafbaar. maand verdienen?
, Stuvia - Koop en Verkoop de Beste Samenvattingen
uncertainty is varying. Some data points are highly certain, some are very solid, some are missing,
also bias…
1.2 WHAT IS DATA?
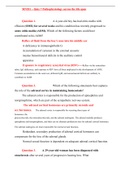
Data is the collection of data objects and their attributes. The object can be
patients, samples, observations,.. Attributes are properties / characteristics
of the object. This will often be represented in a tablet data format where
you have rows for objects and columns for attributes.
Attributes ≠ attribute values
- Attribute values = numbers/symbols assigned to an attribute
o E.g. attribute = eye colour, attribute values = green, blue,
brown
- Distinction between attributes & attribute values
- The same attribute can be mapped to different attribute values
DIFFERENT TYPES OF ATTRIBUTES
1. Nominal attributes: E.g. ID numbers, eye colour, zip codes
2. Ordinal attributes: E.g. rankings (e.g. 1-10), grades, height in tall/medium/short
3. Interval attributes: E.g. calendar dates, temperatures in Celsius or Fahrenheit
4. Ratio attributes: E.g. temperature in Kelvin, length, time, counts
The type of an attribute is based on the type of mathematical operations you can execute on these?
It depends on which of the following properties it possesses:
- Distinctness: =
o Two attributes equal or not Nominal Distinctness
- Order: <>
o You can order them, and it makes sense Ordinal Distinctness & order
- Addition: +-
Interval Distinctness, order & addition
o You can add or subtract values from the
attributes
Ratio All 4 properties
- Multiplication: * /
o You can multiply & divide the attributes
DISCRETE VS. CONTINUOUS ATTRIBUTES
Discrete attribute: have only a finite or countable set of values. They are often represented as
integer variables, for example zip codes, counts, or the set of words in a collection of documents.
Continuous attribute: has real numbers as attribute value. Practically, real values can only be
measured and represented using a finite number of digits but continuous attributes are typically
represented as floating-point variables. For example temperature, height, or weight.
Gedownload door: cynthiavervoort | Wil jij €76 per
Dit document is auteursrechtelijk beschermd, het verspreiden van dit document is strafbaar. maand verdienen?
, Stuvia - Koop en Verkoop de Beste Samenvattingen
1.3 DATASET TYPES
1. Record: data matrix, document data, transaction data
2. Graph: www, protein interactions
3. Ordered: spatial data, temporal data, sequential data, molecular sequences
1. RECORD DATA
= data that consists of a collection of records, each of which consists of a fixed set of attributes.
DATA MATRIX:
If data objects have the same fixed set of numeric attributes, then the data can be thought of as
points in a multi-dimensional space, where each dimension represents a distinct attribute. Such data
set can be represented by an m by n matrix, where there are m rows (objects), and n columns
(attributes). For example a blood sample with for every gene a readout of how much transcript is in
the sample. This is a fixed set of columns for every observation. Every blood sample might have
20.000 attributes, then this blood sample is a point in a space of 20.000 dimensions: high-
dimensional data.
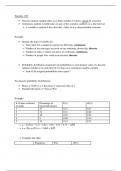
DOCUMENT DATA:
= text data. Every document, for example paper that you have
read becomes a row, and every column is a term attribute and
the number of times this attribute is present in the document.
- Each document becomes a `term' vector
- Each term is a component (attribute) of the vector
The value of each component is the number of times the corresponding term occurs in the
document. You can summarize/translate each document into a list of term abunances: used for
document classification. With a bit of machine learning you can distinct a piece of a poem from a
patient record.
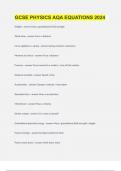
TRANSACTION DATA:
A special type of record data, where each record (column)
corresponds to a transaction that consists of a series of items. For
example, a grocery store. The set of products purchased by a
customer during one shopping trip constitute a transaction, while the
individual products that were purchased are the items.
Gedownload door: cynthiavervoort | Wil jij €76 per
Dit document is auteursrechtelijk beschermd, het verspreiden van dit document is strafbaar. maand verdienen?
Advanced Data Analysis (theoretical
lessons)
geschreven door
Bi0med
www.stuvia.com
Gedownload door: cynthiavervoort | Wil jij €76 per
Dit document is auteursrechtelijk beschermd, het verspreiden van dit document is strafbaar. maand verdienen?
, Stuvia - Koop en Verkoop de Beste Samenvattingen
ADVANCED DATA ANALYSIS
CHAPTER 1: INTRODUCTION 18/02
1.1 BIG DATA
Data for which conventional computer techniques are not sufficient anymore due to size,
complexity.. It is a disruptive trend in computer sciences. Characterised by:
1. Volume 2. Velocity 3. Variety 4. Veracity
Fourth paradigm: for thousands of years we had experimental and observable science, later there
was theoretical science (Newton, formulas…). Then the raise of computer science occurred to
simulate things such as weather forecasts. Now new time of data-driven science where data is the
breeding ground of the science we are doing. You first look at what data is already out there: re-
analyse data.
1. DATA VOLUME
An unprecedented amount of information is coming towards us. For example genomics information
is huge, while the cost of sequencing genomes has gone down tremendously. Computer power is
roughly doubling every 18 months for the same price: faster computers, bigger hard drives. We have
to learn new ways to deal with this big amounts of data.
2. DATA VELOCITY
The speed at which data is generated and the speed at which we need to analyse it. If we sequence a
lot of genomes we can take our times to analyse the genomes and publish it, but some data (such as
sensors) need to be processed immediately.
Also transporting data is a bottleneck: takes too long. Often hard drives are transported, which is
more efficient than internet availability and fibers. Data can be sent from China to here by hard
drives instead of through the internet.
Dynamic molecules profiles can now also be sequenced and analysed, for example by sequencing the
immune system, which is changing constantly. This data is therefore preferably processed instantly,
to know the status of patients in real time.
3. DATA VARIETY
A lot of data in biomedical sciences is heterogenous and unstructured. Most data is based on
literature you need to read, also unstructured image data (just pixels). We estimate that 80% of the
world’s data is structured and also very diverse: DNA sequences, protein structures, gene regulation,
interactions, morphology, metabolism… This data is all heterogenous: difficult to deal with this much
diversity.
4. DATA VERACITY
= trustworthiness of data. There is a lot of uncertainty about data points. This uncertainty is not
consistent: you can’t make a standard deviation of every data point in big data because the
Gedownload door: cynthiavervoort | Wil jij €76 per
Dit document is auteursrechtelijk beschermd, het verspreiden van dit document is strafbaar. maand verdienen?
, Stuvia - Koop en Verkoop de Beste Samenvattingen
uncertainty is varying. Some data points are highly certain, some are very solid, some are missing,
also bias…
1.2 WHAT IS DATA?
Data is the collection of data objects and their attributes. The object can be
patients, samples, observations,.. Attributes are properties / characteristics
of the object. This will often be represented in a tablet data format where
you have rows for objects and columns for attributes.
Attributes ≠ attribute values
- Attribute values = numbers/symbols assigned to an attribute
o E.g. attribute = eye colour, attribute values = green, blue,
brown
- Distinction between attributes & attribute values
- The same attribute can be mapped to different attribute values
DIFFERENT TYPES OF ATTRIBUTES
1. Nominal attributes: E.g. ID numbers, eye colour, zip codes
2. Ordinal attributes: E.g. rankings (e.g. 1-10), grades, height in tall/medium/short
3. Interval attributes: E.g. calendar dates, temperatures in Celsius or Fahrenheit
4. Ratio attributes: E.g. temperature in Kelvin, length, time, counts
The type of an attribute is based on the type of mathematical operations you can execute on these?
It depends on which of the following properties it possesses:
- Distinctness: =
o Two attributes equal or not Nominal Distinctness
- Order: <>
o You can order them, and it makes sense Ordinal Distinctness & order
- Addition: +-
Interval Distinctness, order & addition
o You can add or subtract values from the
attributes
Ratio All 4 properties
- Multiplication: * /
o You can multiply & divide the attributes
DISCRETE VS. CONTINUOUS ATTRIBUTES
Discrete attribute: have only a finite or countable set of values. They are often represented as
integer variables, for example zip codes, counts, or the set of words in a collection of documents.
Continuous attribute: has real numbers as attribute value. Practically, real values can only be
measured and represented using a finite number of digits but continuous attributes are typically
represented as floating-point variables. For example temperature, height, or weight.
Gedownload door: cynthiavervoort | Wil jij €76 per
Dit document is auteursrechtelijk beschermd, het verspreiden van dit document is strafbaar. maand verdienen?
, Stuvia - Koop en Verkoop de Beste Samenvattingen
1.3 DATASET TYPES
1. Record: data matrix, document data, transaction data
2. Graph: www, protein interactions
3. Ordered: spatial data, temporal data, sequential data, molecular sequences
1. RECORD DATA
= data that consists of a collection of records, each of which consists of a fixed set of attributes.
DATA MATRIX:
If data objects have the same fixed set of numeric attributes, then the data can be thought of as
points in a multi-dimensional space, where each dimension represents a distinct attribute. Such data
set can be represented by an m by n matrix, where there are m rows (objects), and n columns
(attributes). For example a blood sample with for every gene a readout of how much transcript is in
the sample. This is a fixed set of columns for every observation. Every blood sample might have
20.000 attributes, then this blood sample is a point in a space of 20.000 dimensions: high-
dimensional data.
DOCUMENT DATA:
= text data. Every document, for example paper that you have
read becomes a row, and every column is a term attribute and
the number of times this attribute is present in the document.
- Each document becomes a `term' vector
- Each term is a component (attribute) of the vector
The value of each component is the number of times the corresponding term occurs in the
document. You can summarize/translate each document into a list of term abunances: used for
document classification. With a bit of machine learning you can distinct a piece of a poem from a
patient record.
TRANSACTION DATA:
A special type of record data, where each record (column)
corresponds to a transaction that consists of a series of items. For
example, a grocery store. The set of products purchased by a
customer during one shopping trip constitute a transaction, while the
individual products that were purchased are the items.
Gedownload door: cynthiavervoort | Wil jij €76 per
Dit document is auteursrechtelijk beschermd, het verspreiden van dit document is strafbaar. maand verdienen?